INTRODUCTION
This chapter describes the revenue sources, both tax supported and non-tax supported, used to fund the County Executive's Recommended FY27 Operating Budget, and the amount of revenue the County anticipates receiving from those sources. The chapter details the demographic and economic assumptions, including discussions of the national, State, and local economies, that were made in the development of the revenue forecast.
REVENUE FORECAST ASSUMPTIONS
Policy Assumptions
Revenue and resource estimates presented are the result of the recommended policies of the County Executive for the FY27 budget. Even though it is assumed that these policies will be effective throughout the six-year period, subsequent Council actions, State law and budgetary changes, actual economic conditions, and revised revenue projections may result in policy changes in later years.
Demographic Assumptions
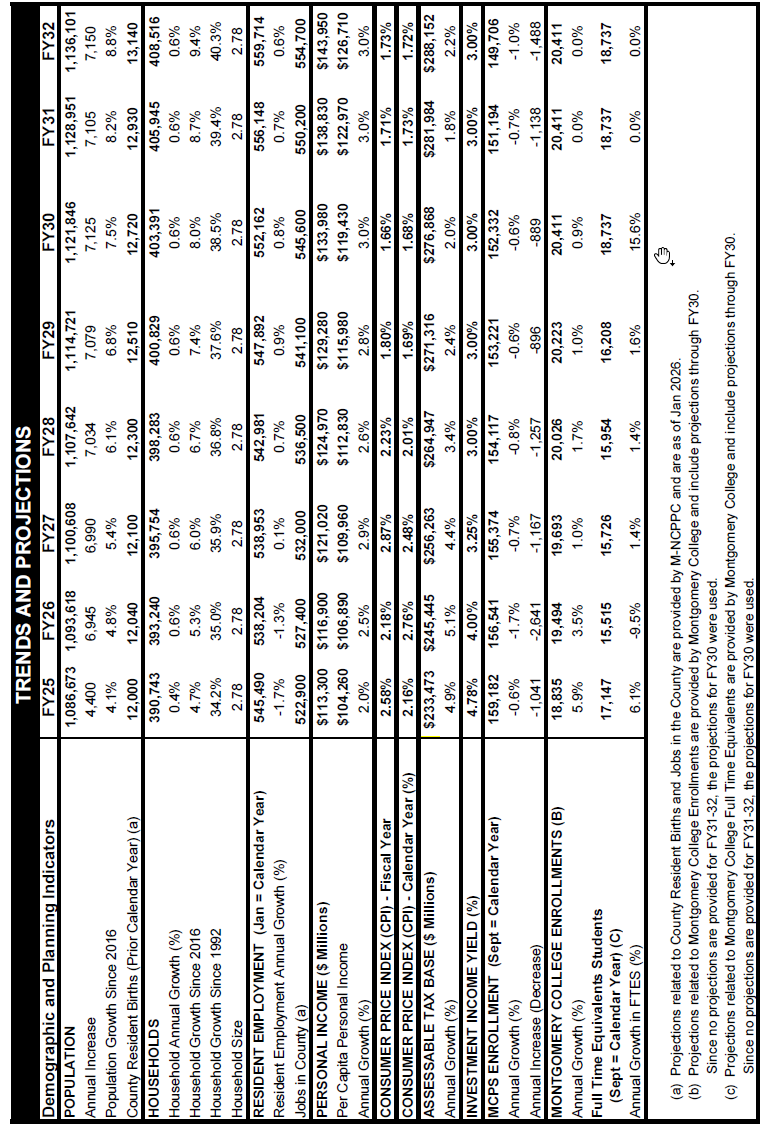
The revenue projections of the Public Services Program (PSP) incorporate demographic assumptions based on data from Moody's Analytics and Metropolitan Washington Council of Governments (COG) and are based on fiscal and economic data and analyses used or prepared by the Department of Finance (Finance). A Demographic and Economic Assumptions chart located at the end of this chapter provides several demographic and planning indicators.
- County population will continue to increase from 1,082,273 in 2024 (Census) to 1,150,536 by 2034. This reflects an average annual growth rate of 0.6 percent.
- Current projections estimate the number of households to increase from 389,161 (Census) in 2024 to 413,707 by 2034. Household growth over that period is projected to grow at an average annual rate of 0.6 percent.
- County births, which are one indicator of future elementary school populations and child day care demand, are projected to gradually increase from an estimated 12,000 in 2025 to 13,140 by 2032.
- The County expects Montgomery County Public Schools student enrollment to decrease by 6,835 between FY26 and FY32.
- Montgomery College full-time equivalent student enrollments are projected to increase from 15,515 in FY26 to 18,737 in FY30.
Economic Assumptions
Despite increased national economic volatility in calendar year (CY) 2025, Montgomery County's economy experienced growth with higher resident income levels and median home prices. However, flat residential employment and little growth in home sales hint at the challenges to achieving the county's full economic potential. These mixed signals provide support for continued revenue growth in the short term but possibly warn that in the longer term this growth may not be sustainable.
The FY27 budget revenue forecast incorporates the assumption that the United States will not experience a recession in the coming year. There is considerable uncertainty regarding Federal policies and actions as well as concerns that economic growth rests upon limited industry sectors. However, local economic indicators remain consistent with continued economic growth, supporting the decision not to incorporate a recession and assume a reduced revenue growth rate in Montgomery County.
ECONOMIC OUTLOOK
The forecast for the local economy is also mixed. While resident income levels are anticipated to continue growing consistent with long-term trends, resident employment and jobs located in Montgomery County (payroll employment) are expected to stagnate throughout the forecast period. The slow growth in both resident employment and payroll employment could generate headwinds that limit local economic activity and ultimately result in disappointing revenue growth.
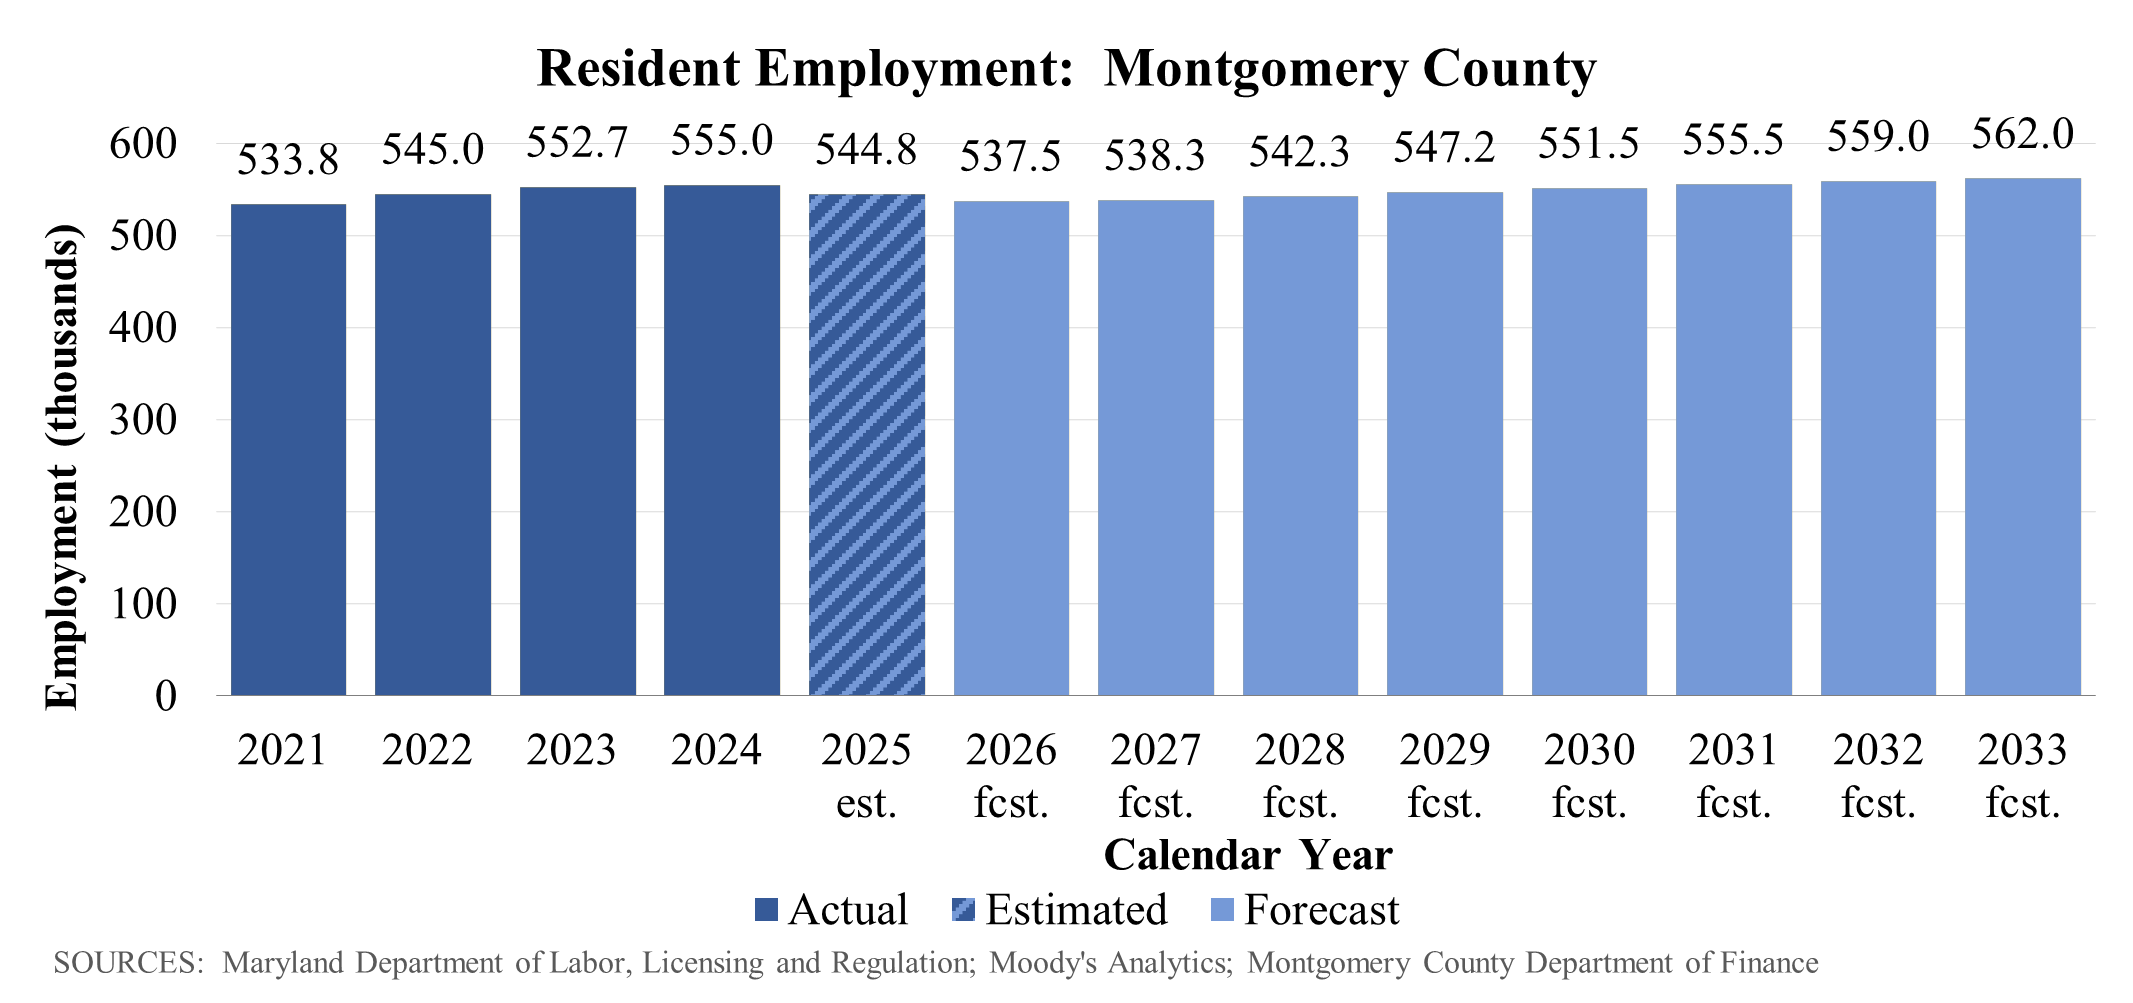
Employment
Resident employment refers to the number of residents employed, regardless of whether that job is located in Montgomery County or elsewhere. As Montgomery County's income tax is imposed on residents, regardless of where income is earned, resident employment is a key indicator for income tax revenues.
Based on data from the Maryland Department of Labor, Licensing and Regulation (DLLR) and the Bureau of Labor Statistics, U.S. Department of Labor, resident employment declined by 1.84 percent from CY2024 to CY2025, a second year in which resident employment growth has slowed. Finance forecasts that resident employment will again decline in CY2026 and will increase at an average annual rate of 0.4percent from CY2025 to CY2033. Due to this slow growth rate resident employment is expected to next exceed its recent CY2024 high in CY2031.
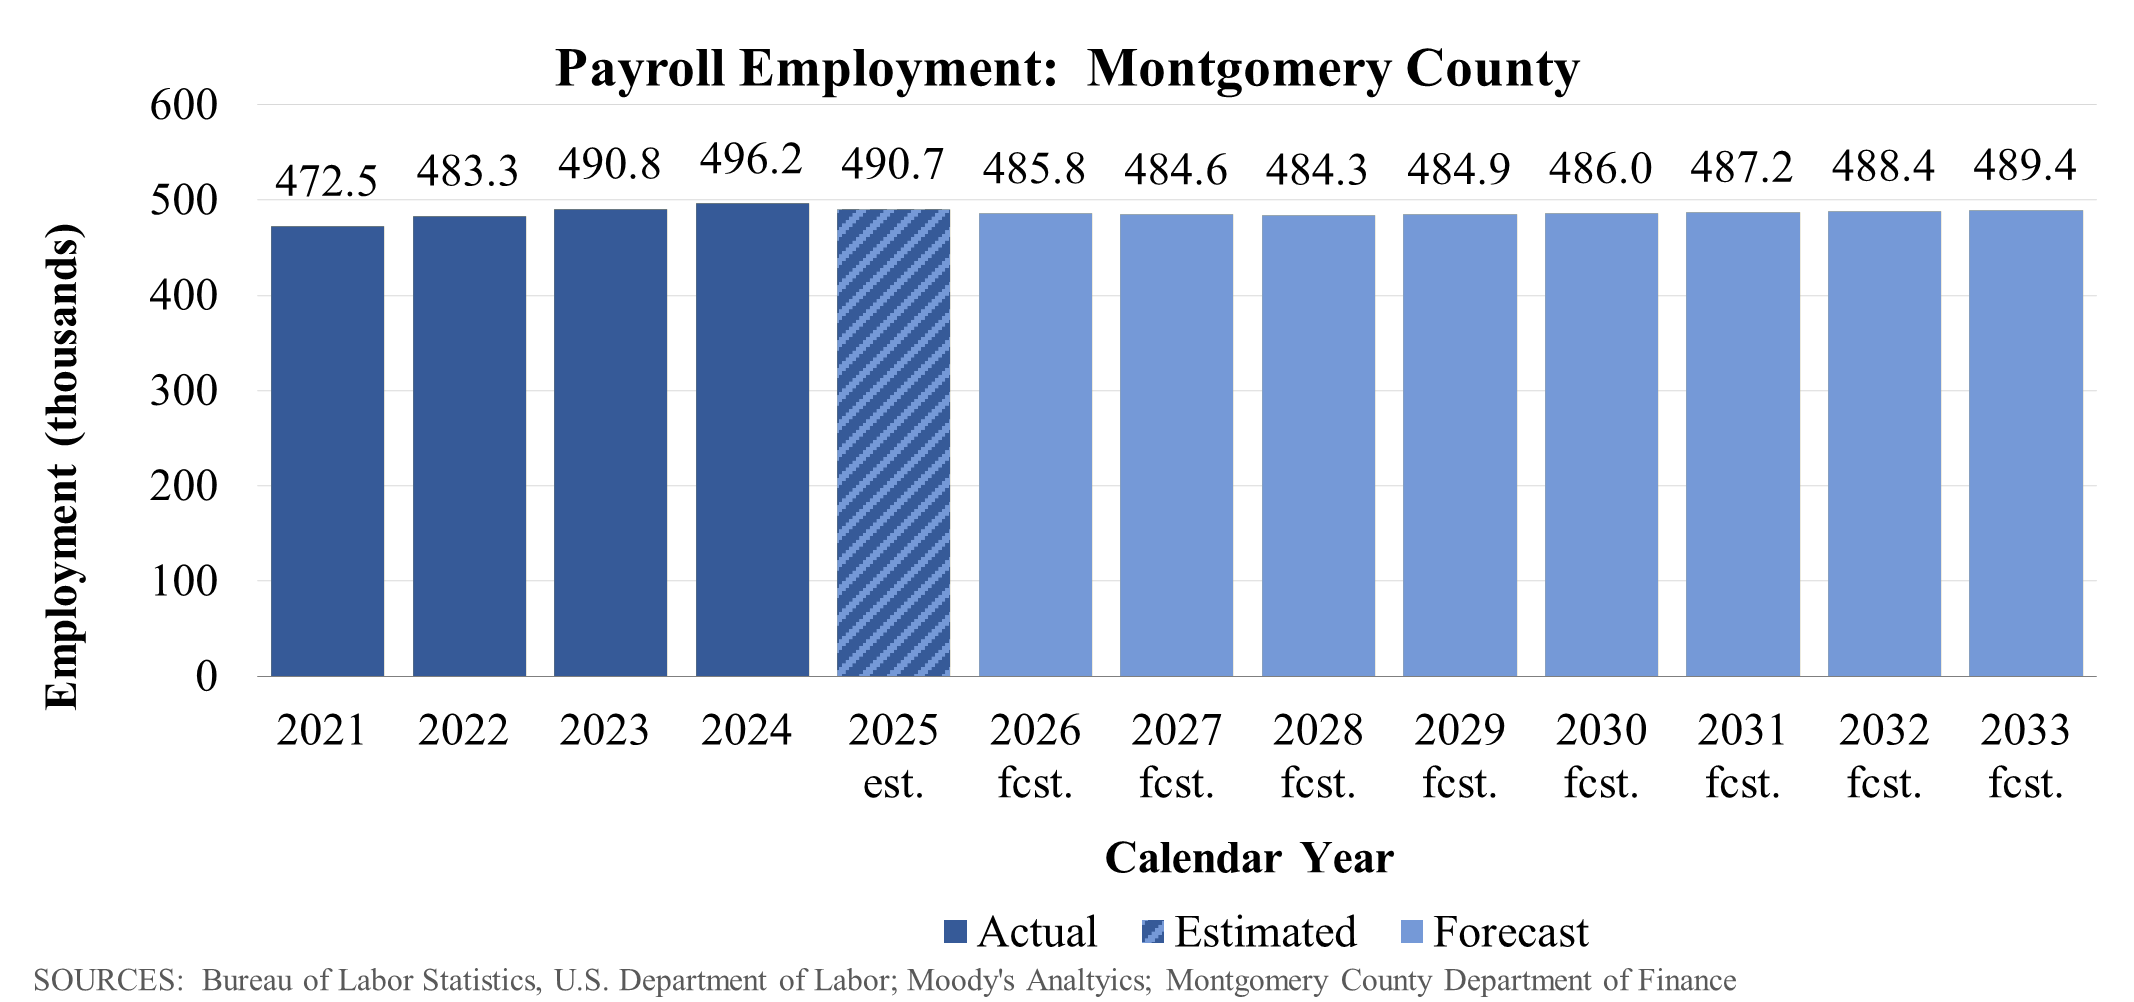
Payroll employment refers to the number of jobs located in Montgomery County and its growth is a result of business development and job creation locally, indicative of the strength of the local economy. Finance assumes that payroll employment will remain essentially unchanged from CY2025 to CY2032, with modest increases or decreases in each year.
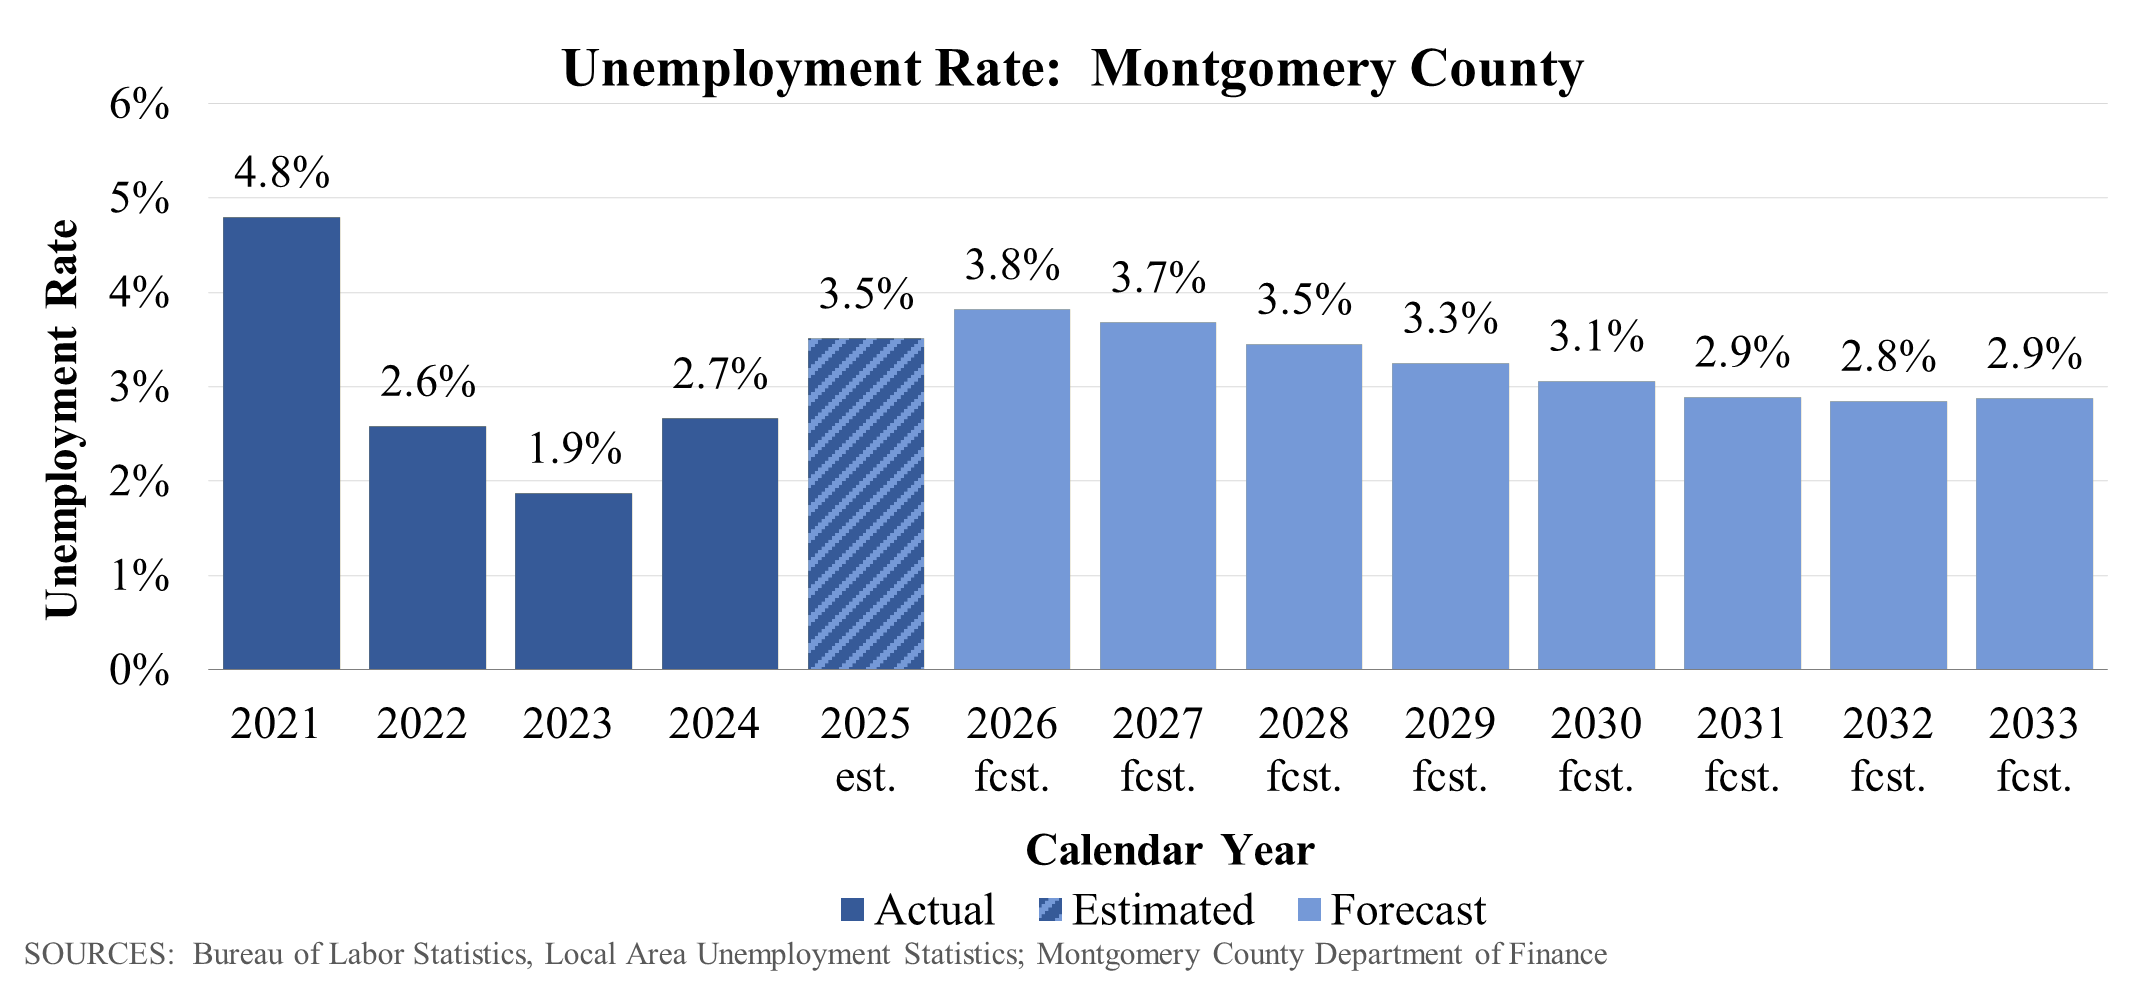
The unemployment rate is an indicator of general economic strength as a lower rate is usually associated with strong employment and with increasing wage income. In CY2025 the County's unemployment rate continued to climb, reaching 3.5 percent. This is the result of the labor force declining by 5,575 people but resident employment declining even more by 10,210. Finance assumes that unemployment will peak at 3.8% in CY2026 and that the economy will then approach near full employment with the unemployment rate declining to 3.1 percent by CY2030.
Resident Income
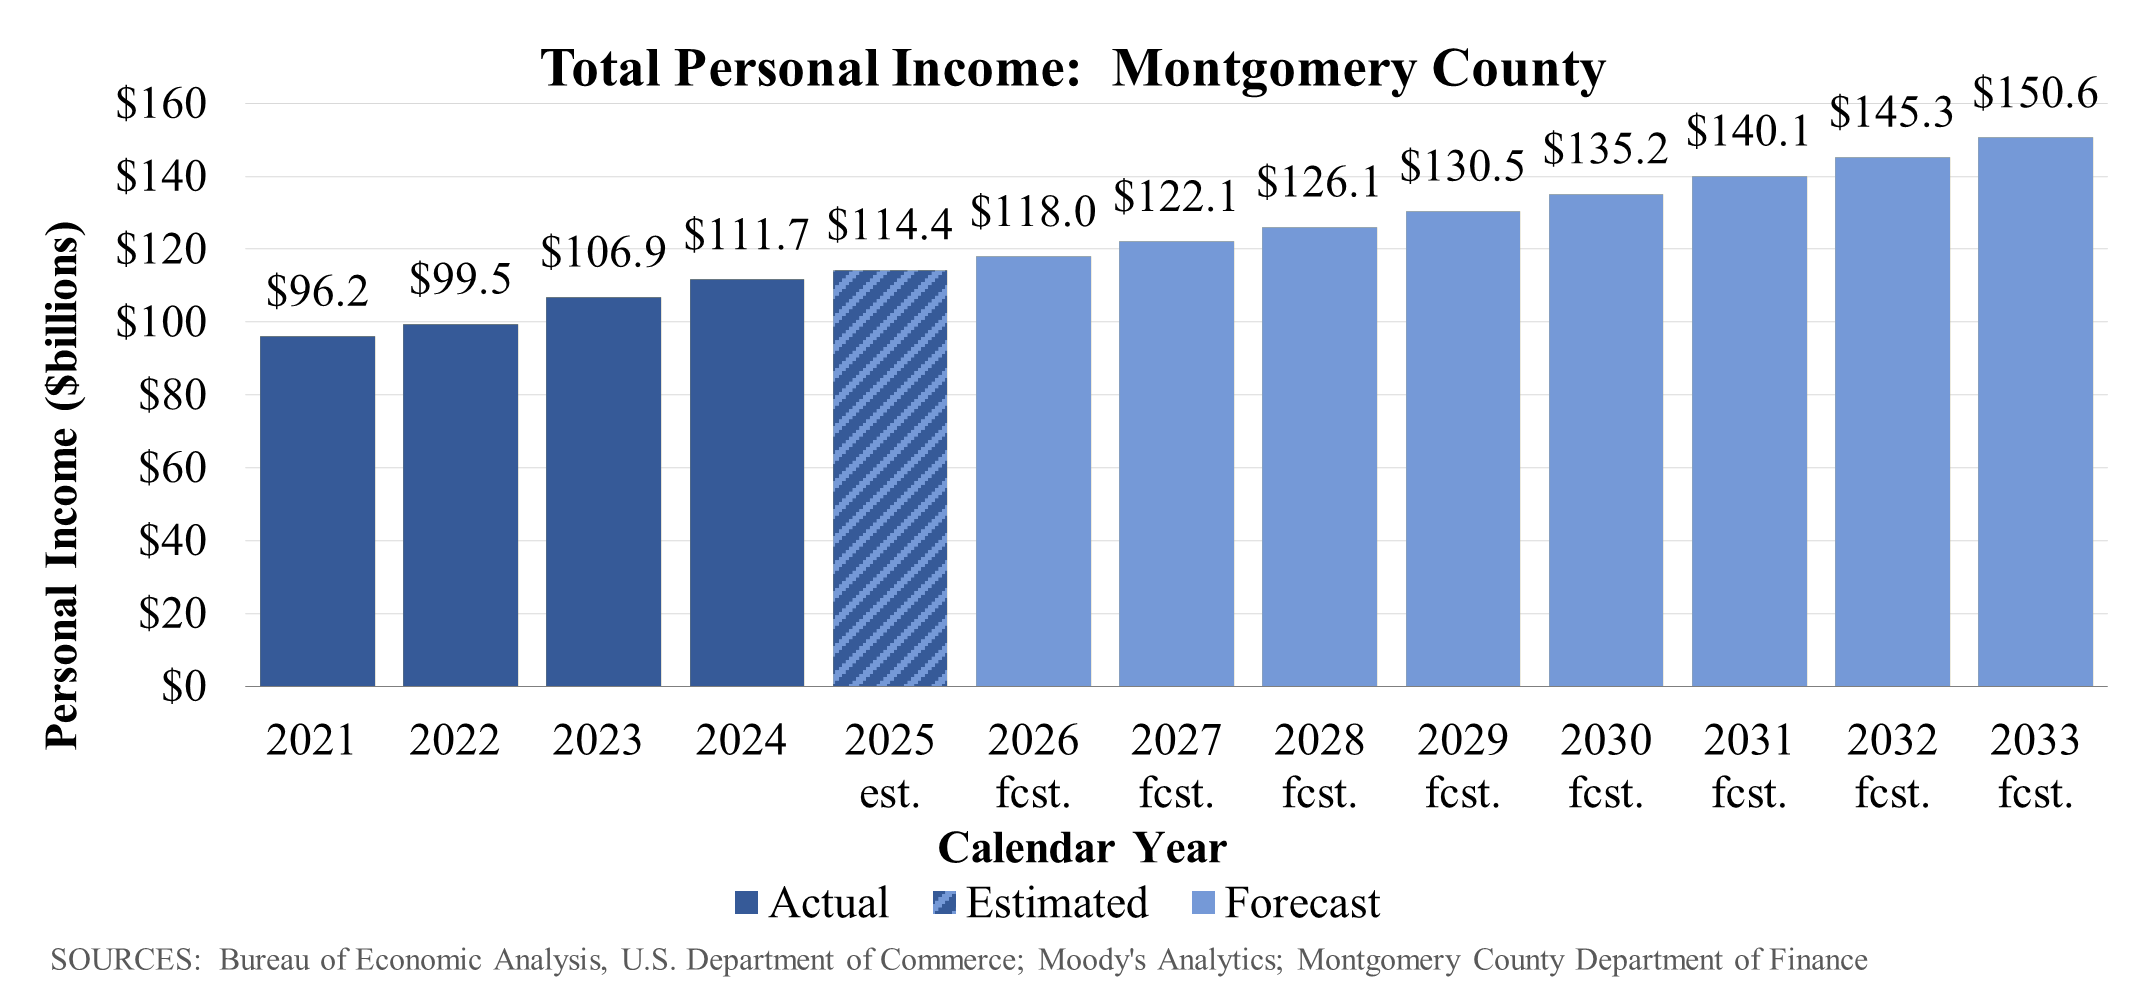
Total personal income refers to the sum of wage and salary income and non-wage income, which includes transfer payments, proprietor's income, dividends/interest/rental income, but excludes capital gains. Total personal income and its components are key factors for income tax revenues and the forecast growth in that revenue source.
Total personal income grew steadily coming out of the pandemic, at an annualized 4.73 percent pace from CY2020 to CY2025, reflecting the strength in the regional labor market and growth in household finances during this period. Finance assumes that total personal income in Montgomery County will continue to grow, increasing at an average annual rate of 3.50 percent from CY2025 to CY2033, an indication that income tax may continue increasing though at a somewhat reduced pace in nominal terms.
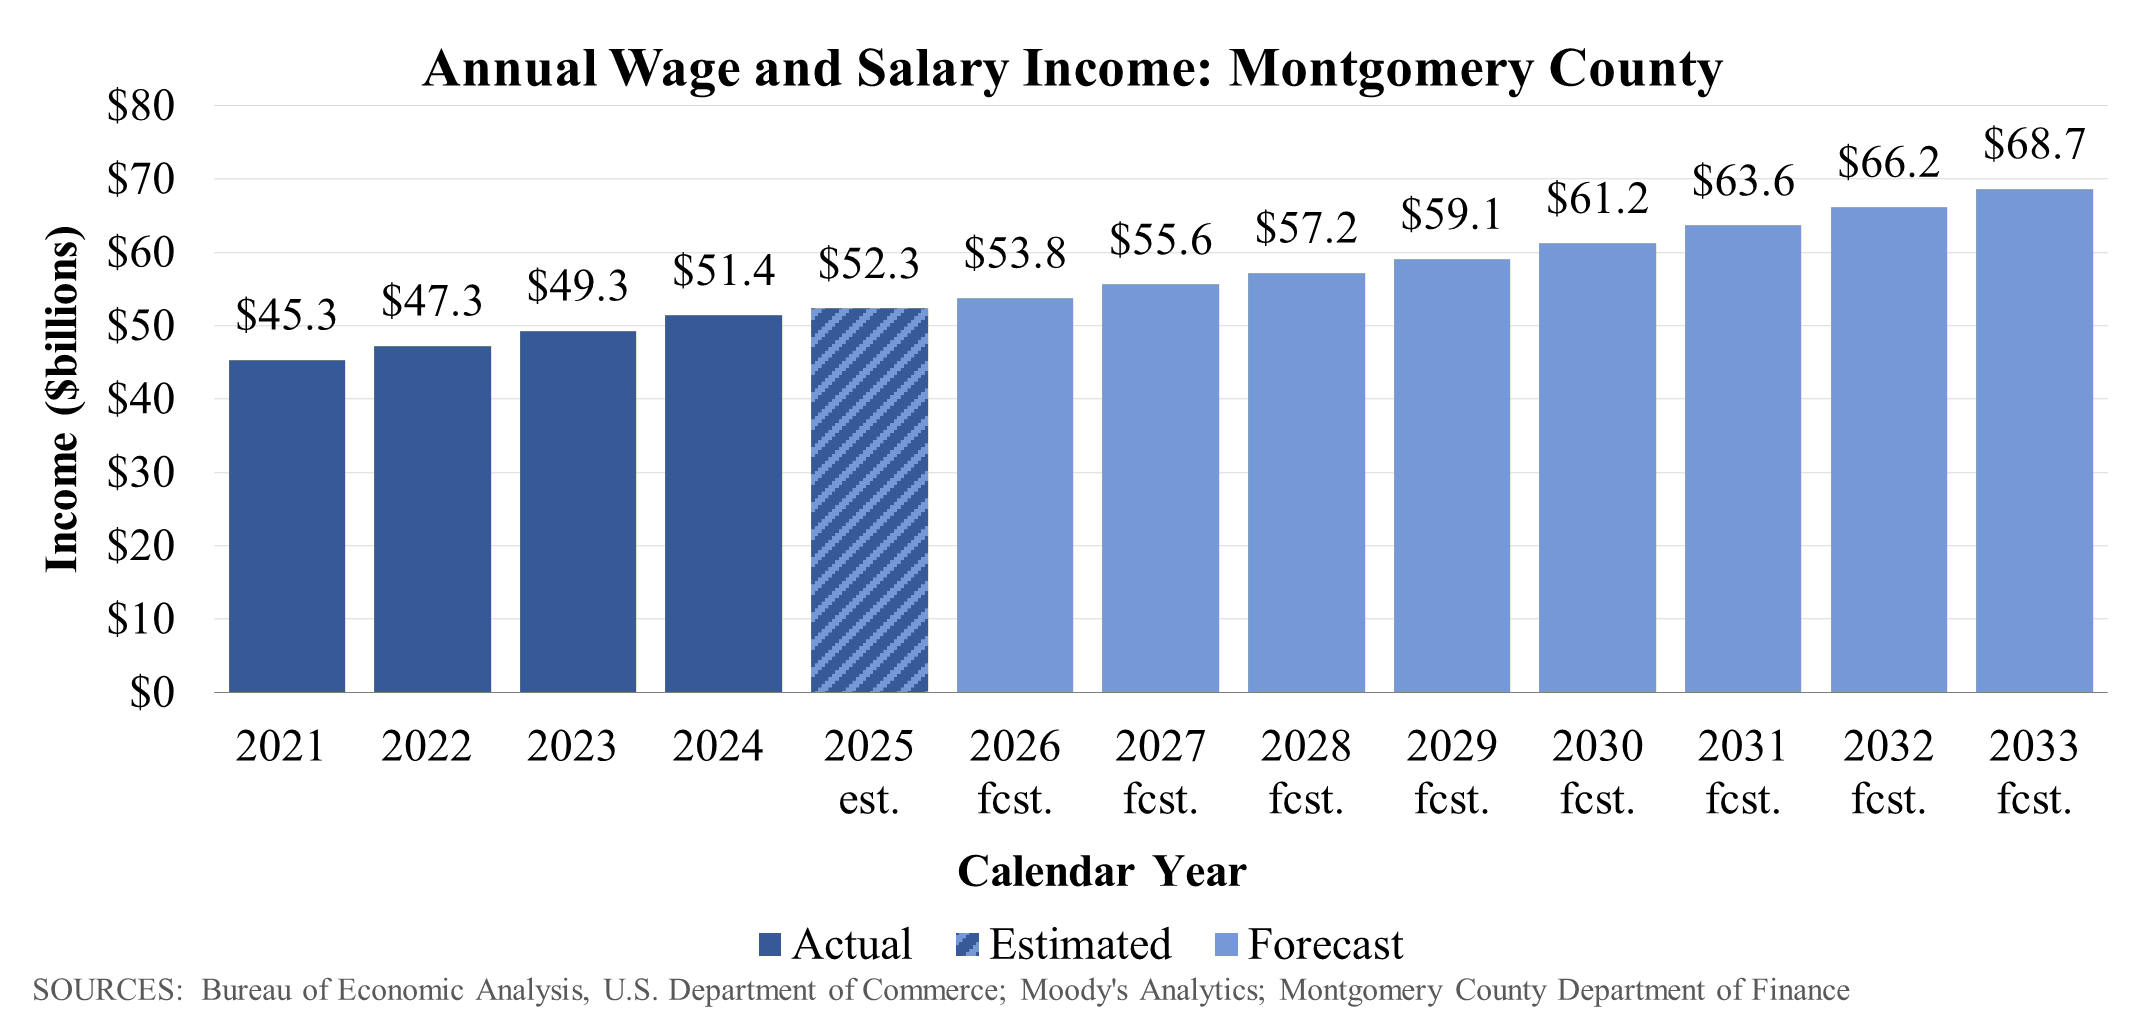
Wage and salary income refers to employment income earned by salaried and waged employees and is impacted by labor market conditions, inflation patterns, and population growth/demographic changes in Montgomery County. Finance assumes wage and salary income will continue growing but at a slightly reduced pace from the recent past; wage and salary income grew at a 4.8 percent annualized pace from CY2020 to CY2025 and is expected to continue growing at a 3.6 percent annualized pace from CY2025 to CY2033. This growth rate is despite the fact that the number of employed residents is expected to experience little change and thus reflects an increase in nominal terms in the wage per hour of employee labor.
Non-Wage Income1 refers to various types of income not obtained through wages and salary, such as proprietor/s income, transfer receipts, and dividends (see note below for specific components). Finance forecasts that non-wage income in Montgomery County will increase at an average annual rate of 3.7 percent from CY2025 to CY2033, a slower pace than the 5.1 percent average annual growth from 2020 to 2025.
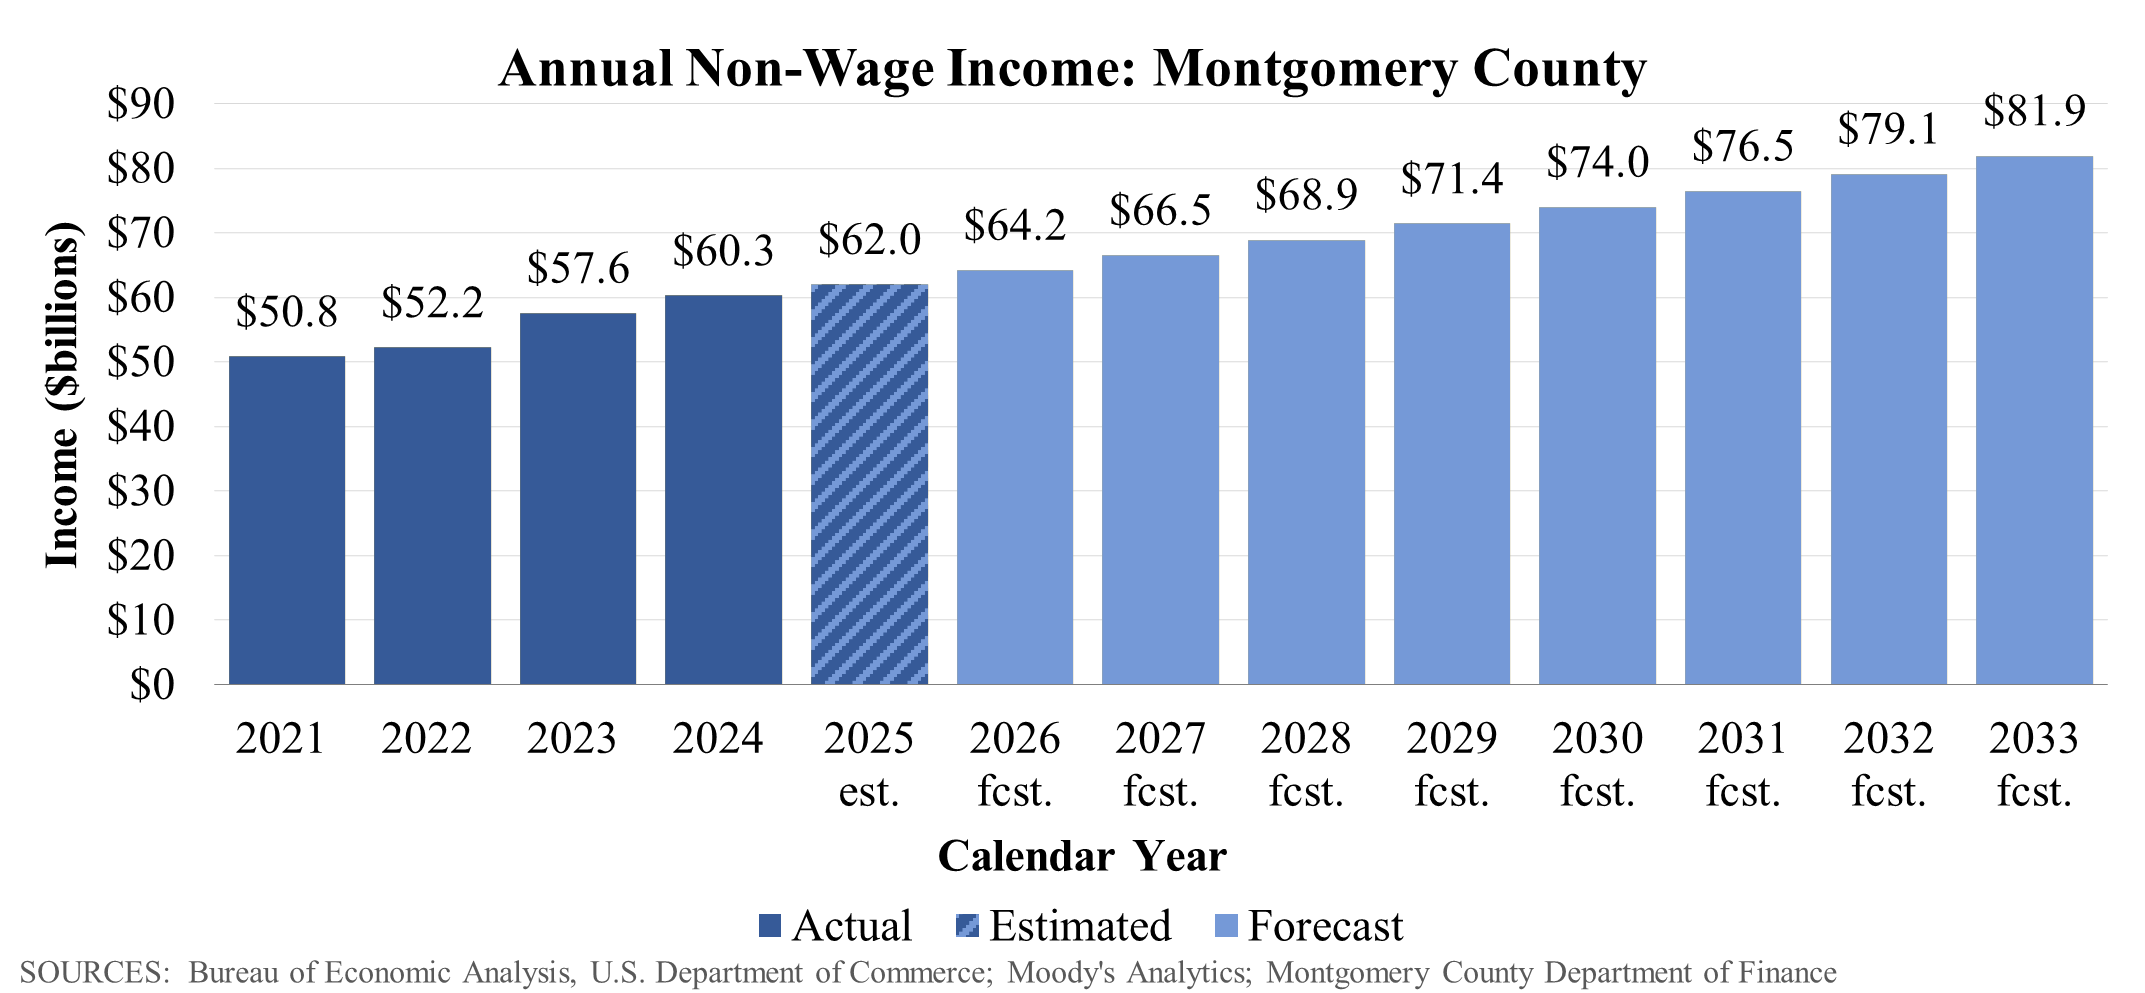
1Non-wage income is the sum of proprietor's income, supplements to wages and salaries, transfer receipts, dividends/interest/rents, adjustment for residence, less contributions for government social insurance.
Residential Real Estate
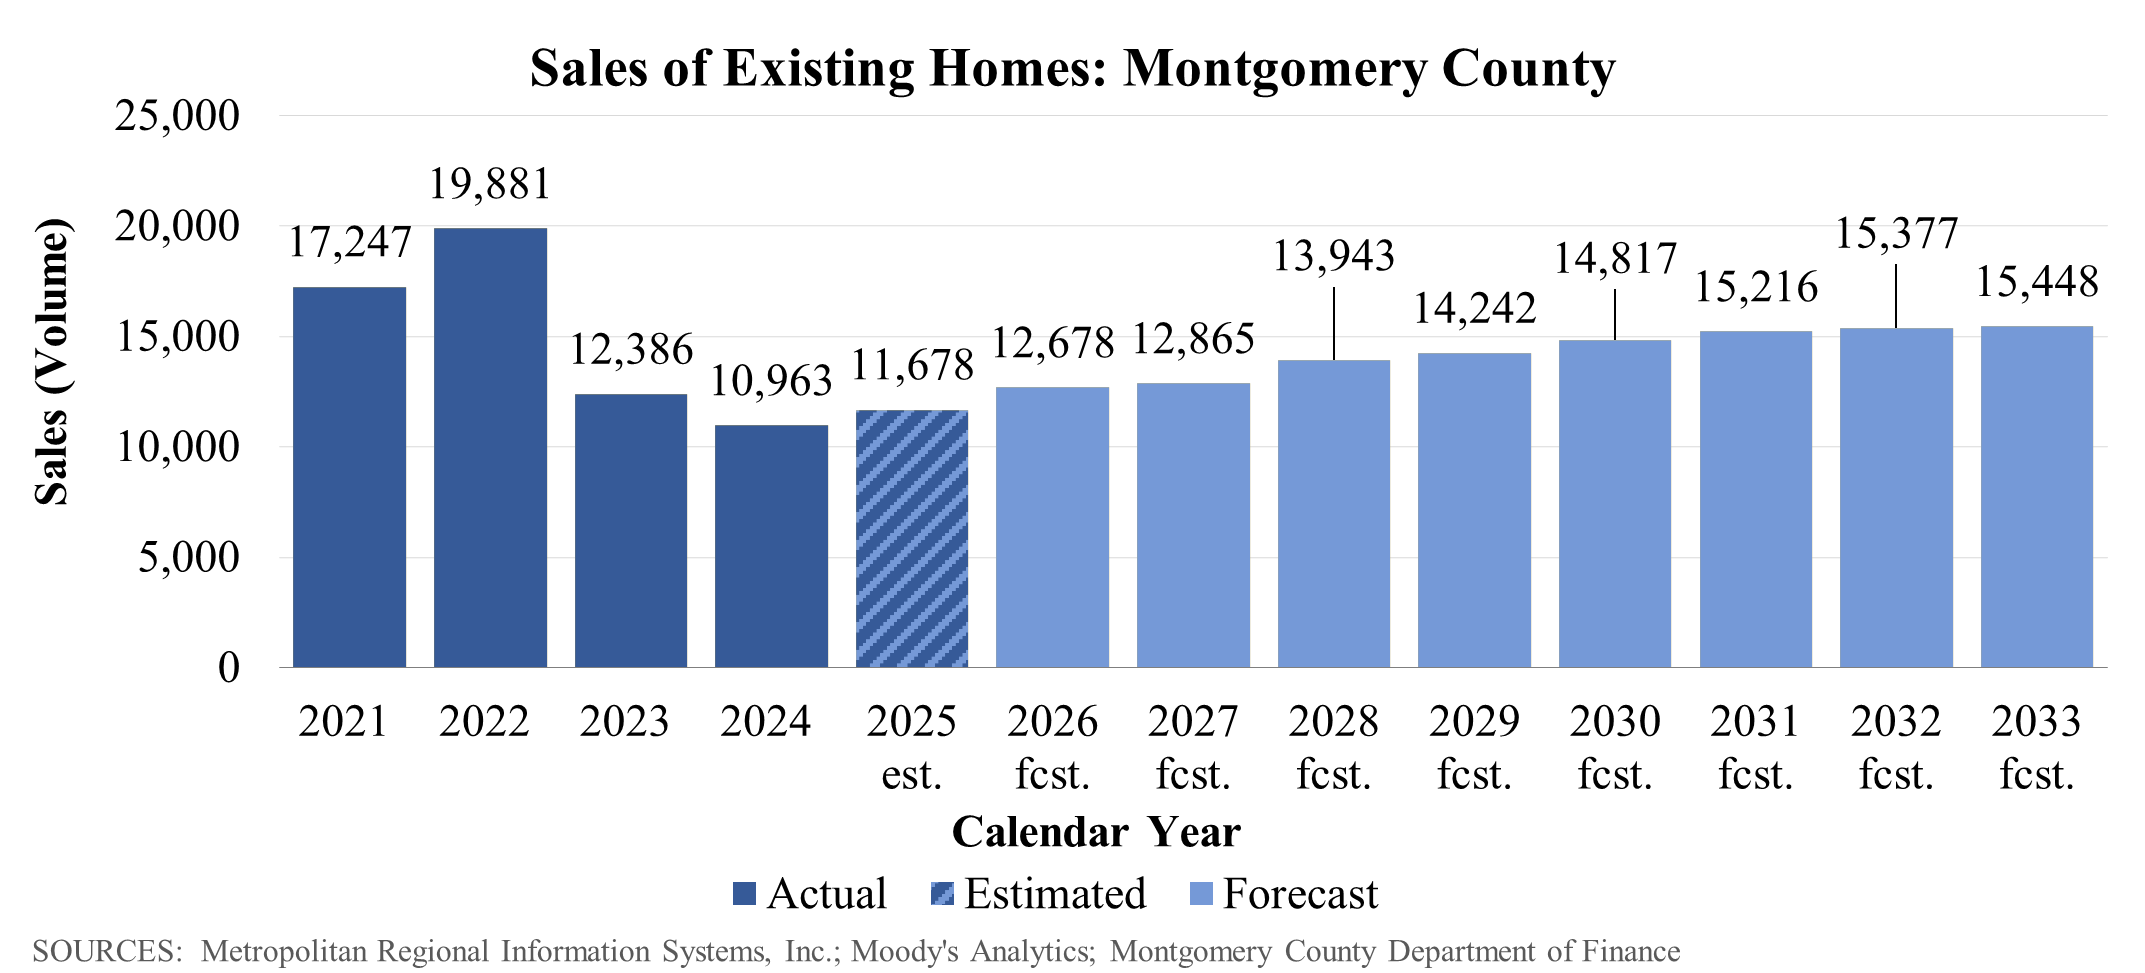
The sales of existing homes in Montgomery County influences the amount of transfer and recordation tax revenue. The number of homes sold reflects dynamics in the real estate market, the demand and supply of homes for sale, and is highly influenced by the level of interest rates.
Finance anticipates that sales of existing homes will continue recovering from the reduced pace experienced since CY2023 when the Federal Reserve began raising interest rates. This forecast does depend upon the home sale market continuing to unlock as mortgage rates continue to moderate and more households experience a need to move despite the higher interest rate for a new mortgage. Finance anticipates home sales will eventually plateau around 15,000 sales annually, below the levels experienced during the COVID pandemic.
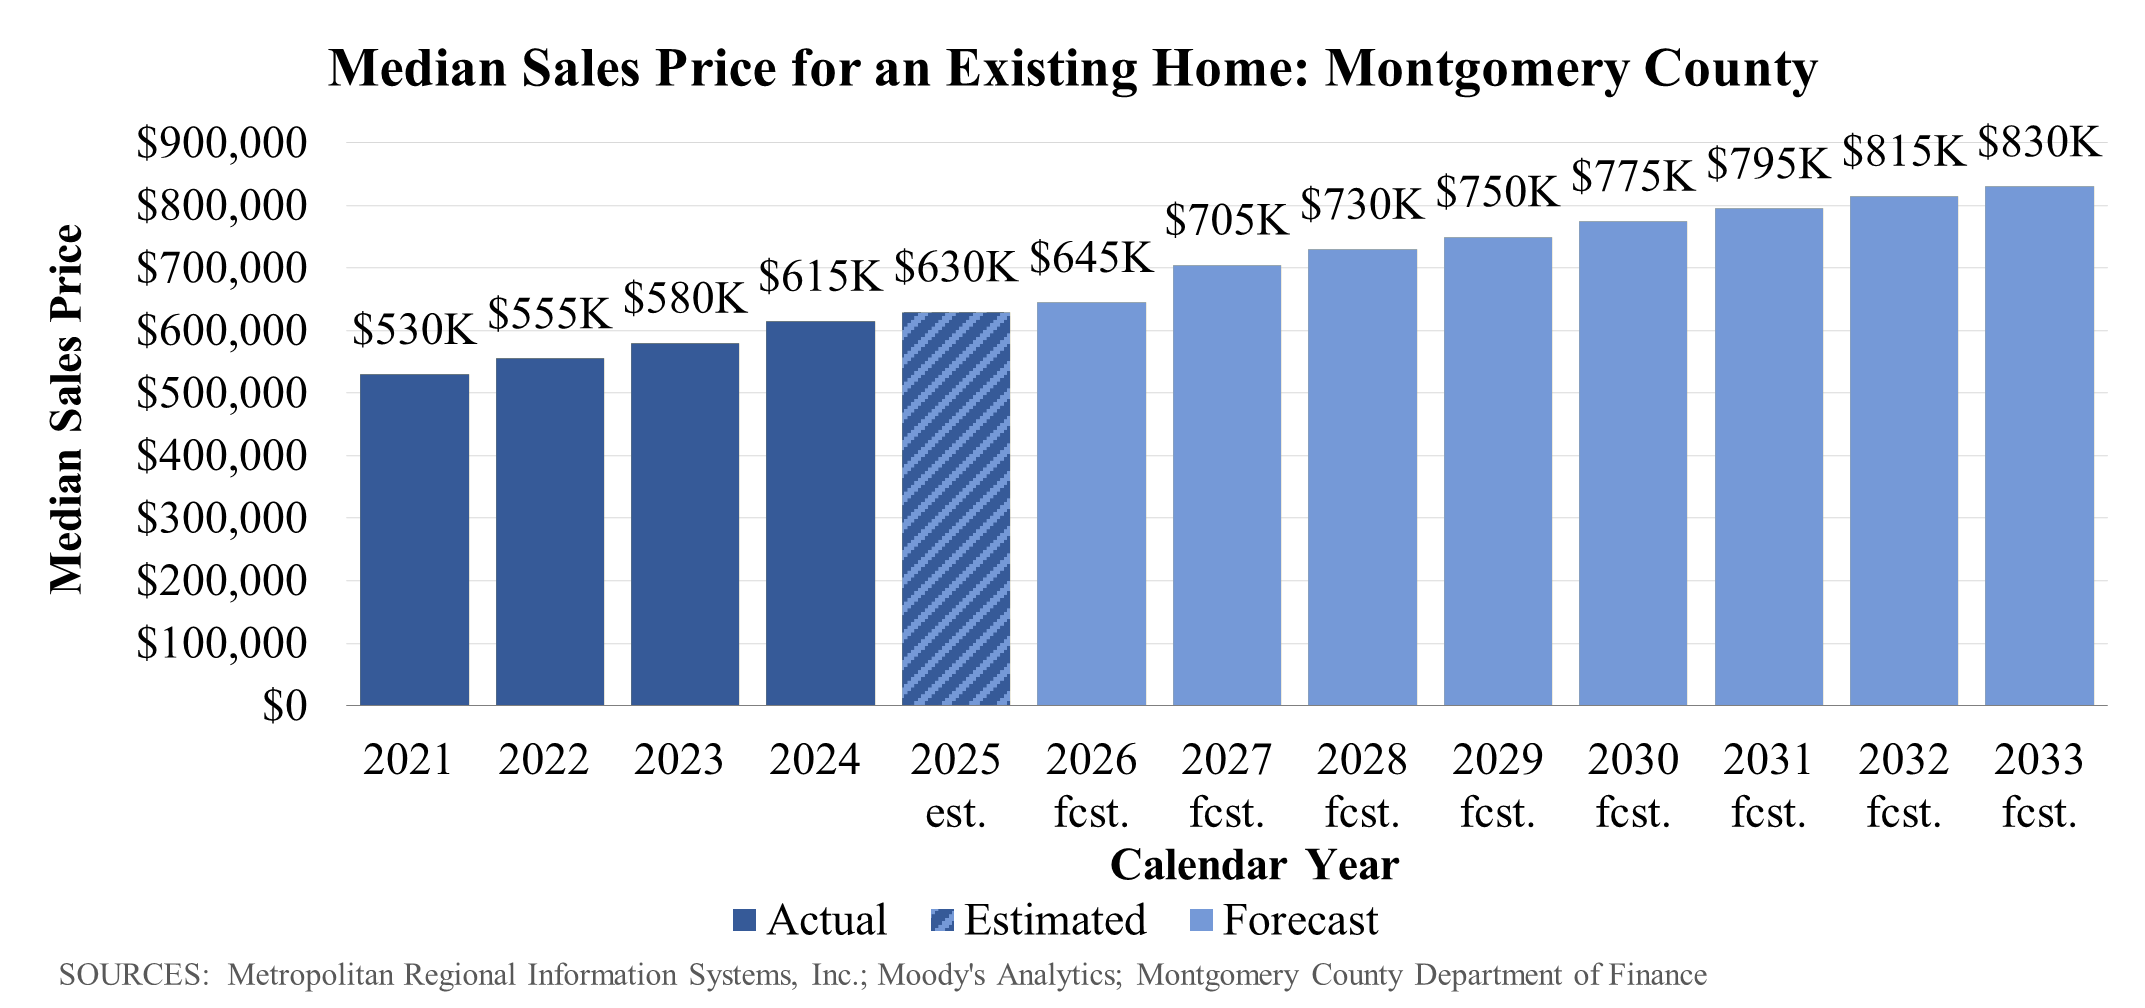
The median sales price for housing in Montgomery County reflects the value residents place on living within the County. The price of homes sold directly affects transfer and recordation tax revenues and influences the assessed value of property which in turn determines property tax revenues.
Home prices continue to reflect elevated desire to live in Montgomery County and the relative lack of supply of homes for sale, with prices increasing at a 5.6 percent average annualized pace from CY2019 to CY2025. Finance expects home price growth to moderate to a 3.5 percent average annualized pace of growth from CY2025 to CY2033.
Construction Activity
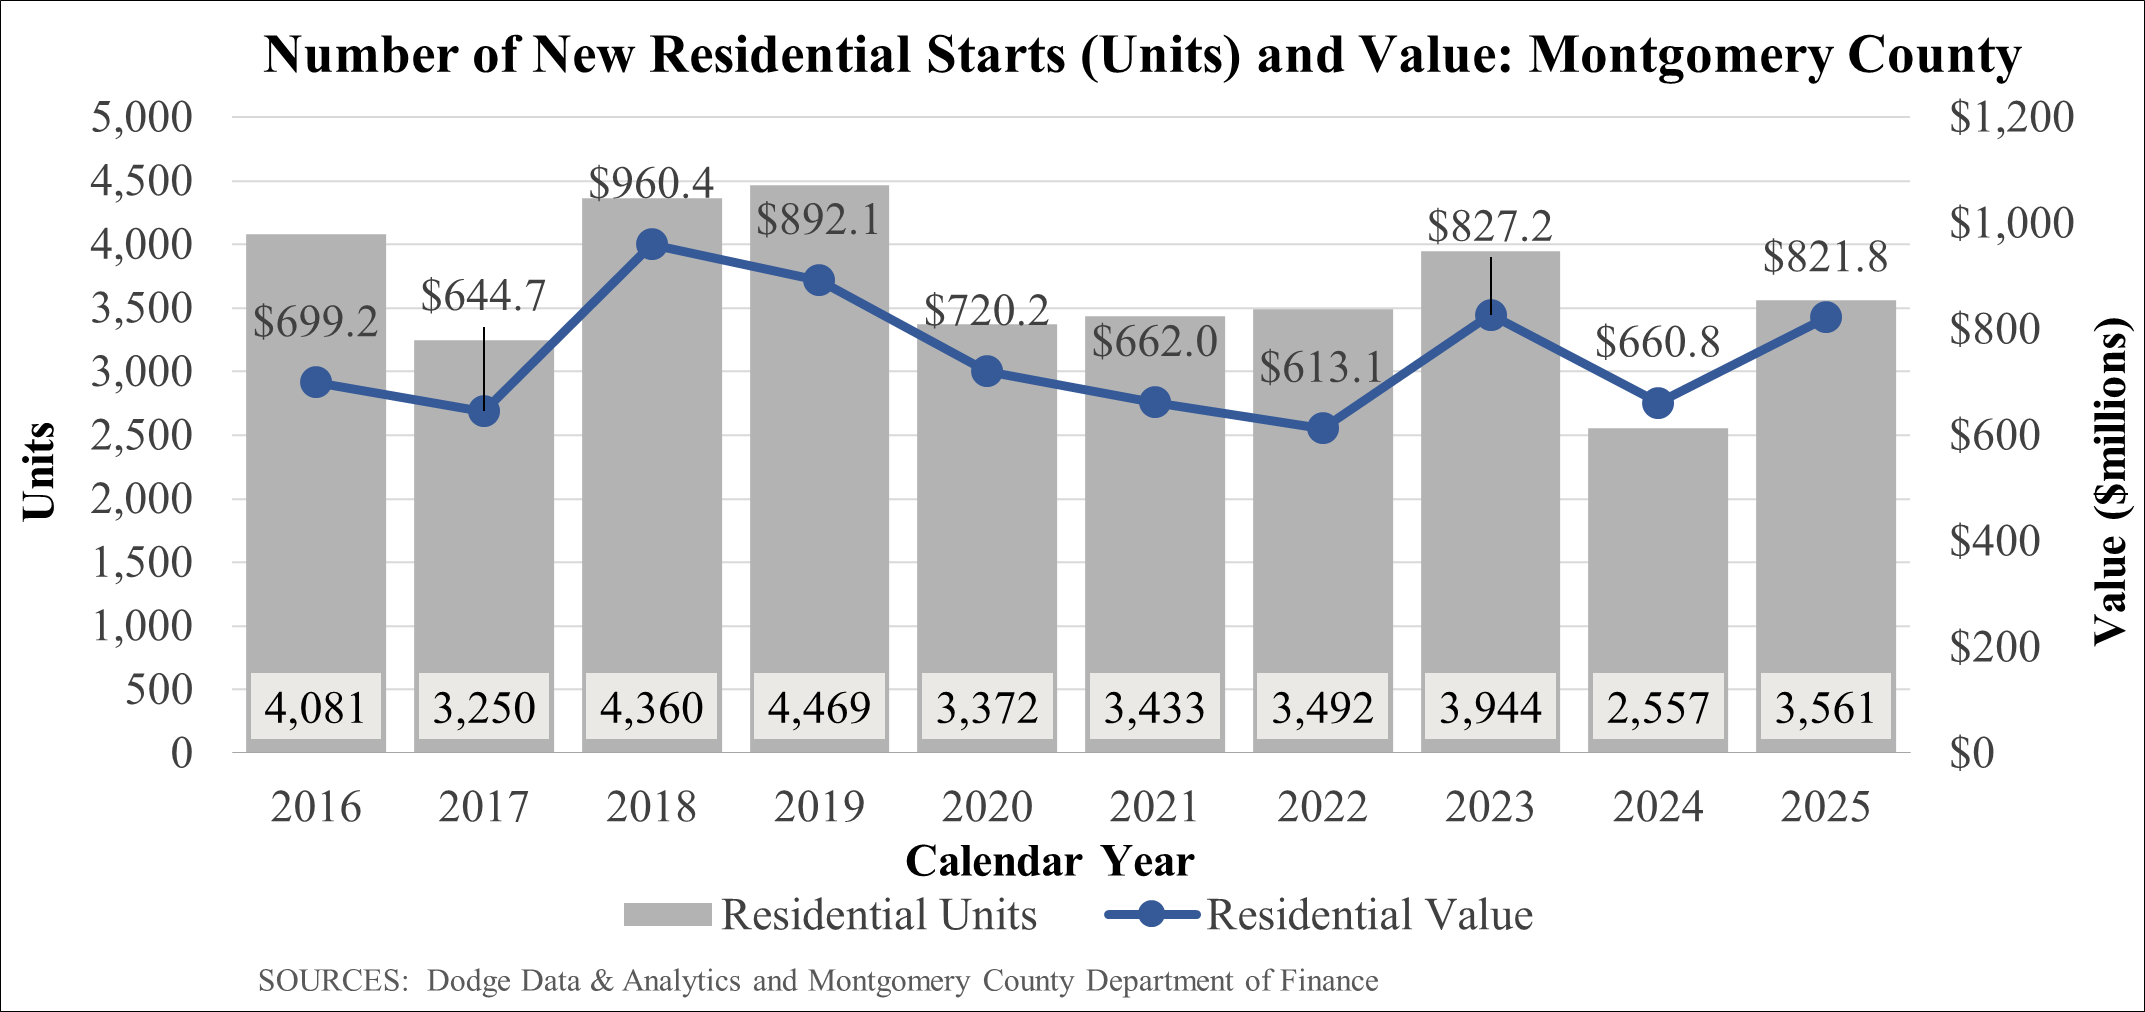
Construction is one of the driving forces of the economy and provides insight into the future trajectory of assessed values and by extension property tax revenues.
Some concern noted in the press that Montgomery County is attracting less residential construction investment is not apparent in the data on the number of residential units under construction. The number of new residential units and the total value of those units increased in CY2025, up 39.3 percent and by 24.4 percent respectively. Montgomery County does not forecast future construction activity.
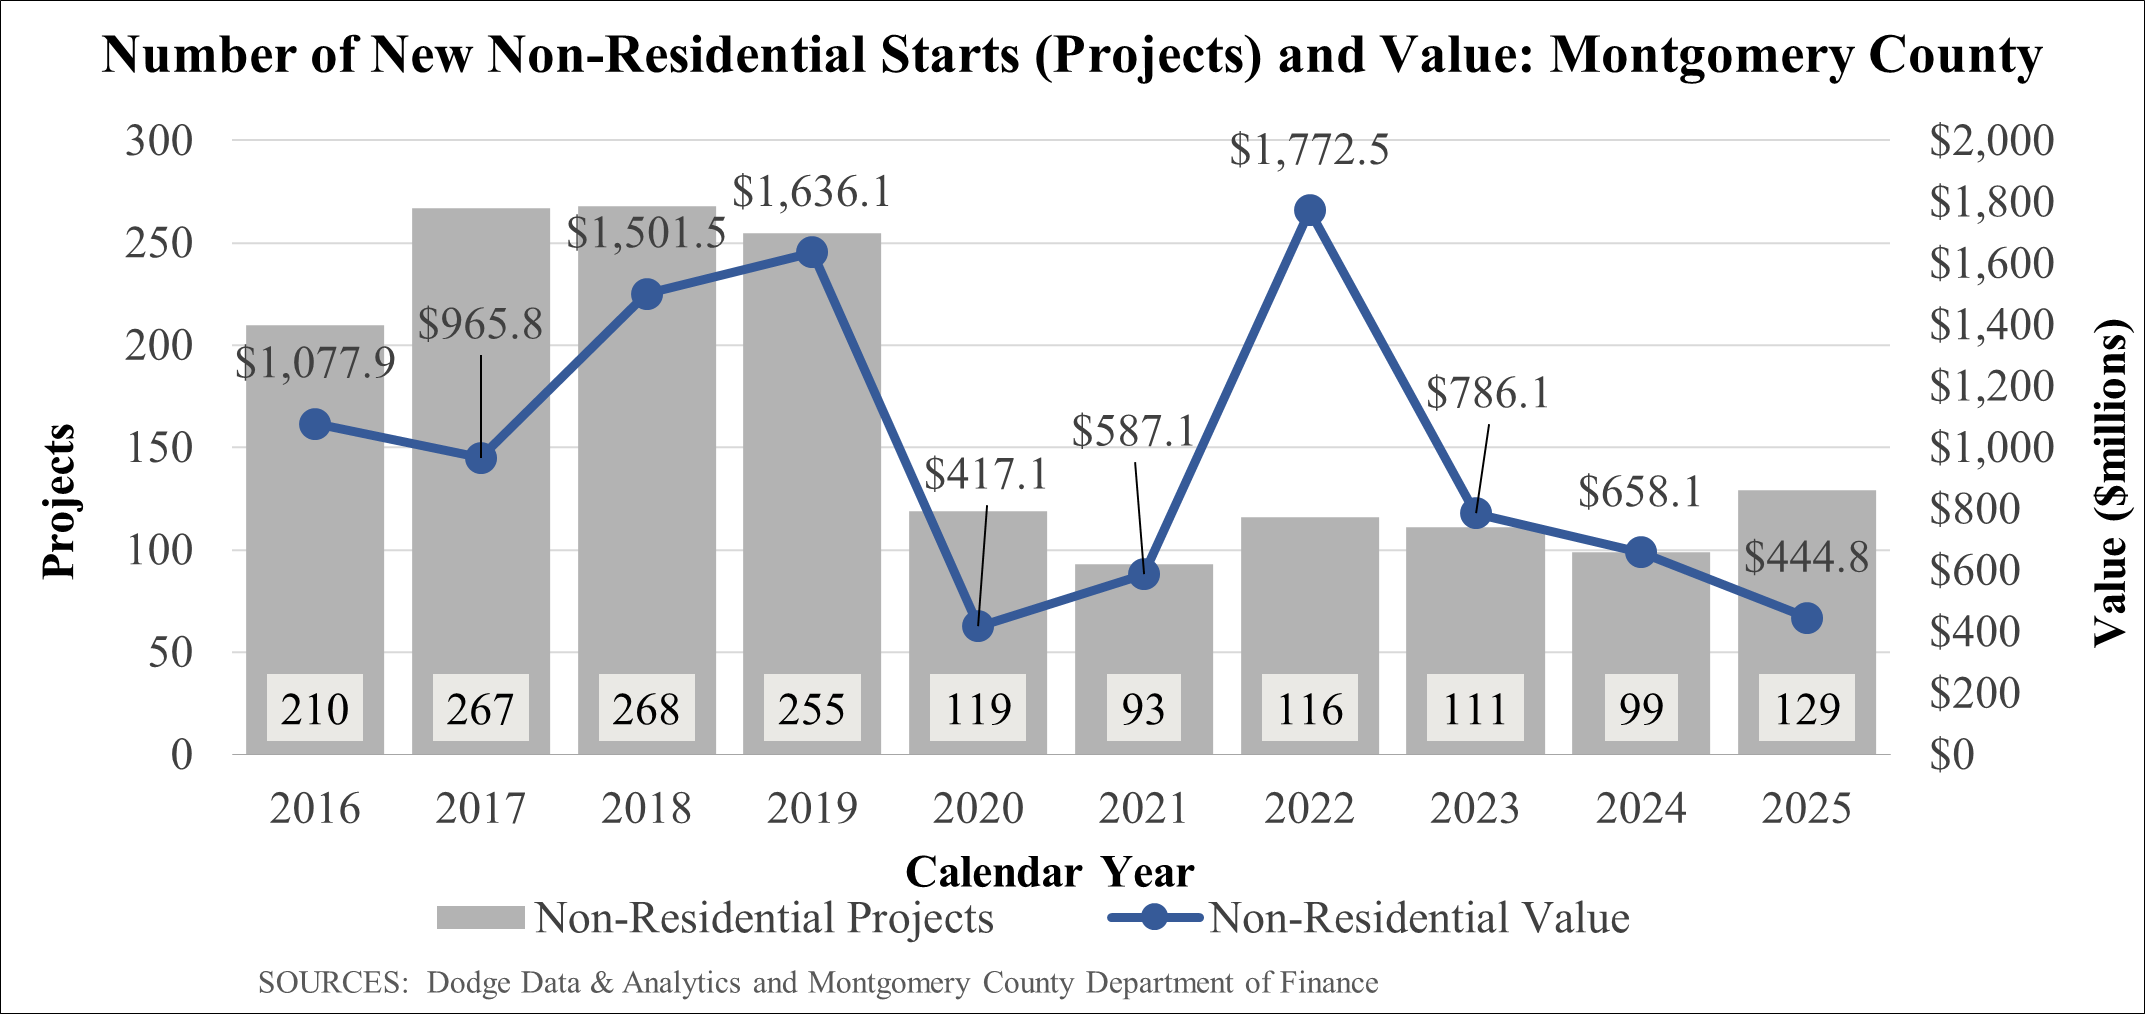
The number of projects and the value of new non-residential constructions projects in Montgomery County remains lower than its pre-CY2019 trend. Finance attributes this decline to the disruption COVID-19 caused to the use of space and by extension the non-residential real estate market. Non-residential projects continued at this lower rate in CY2025 with little change since CY2019 in number of projects and except for CY2022, in the value of those projects.
Inflation
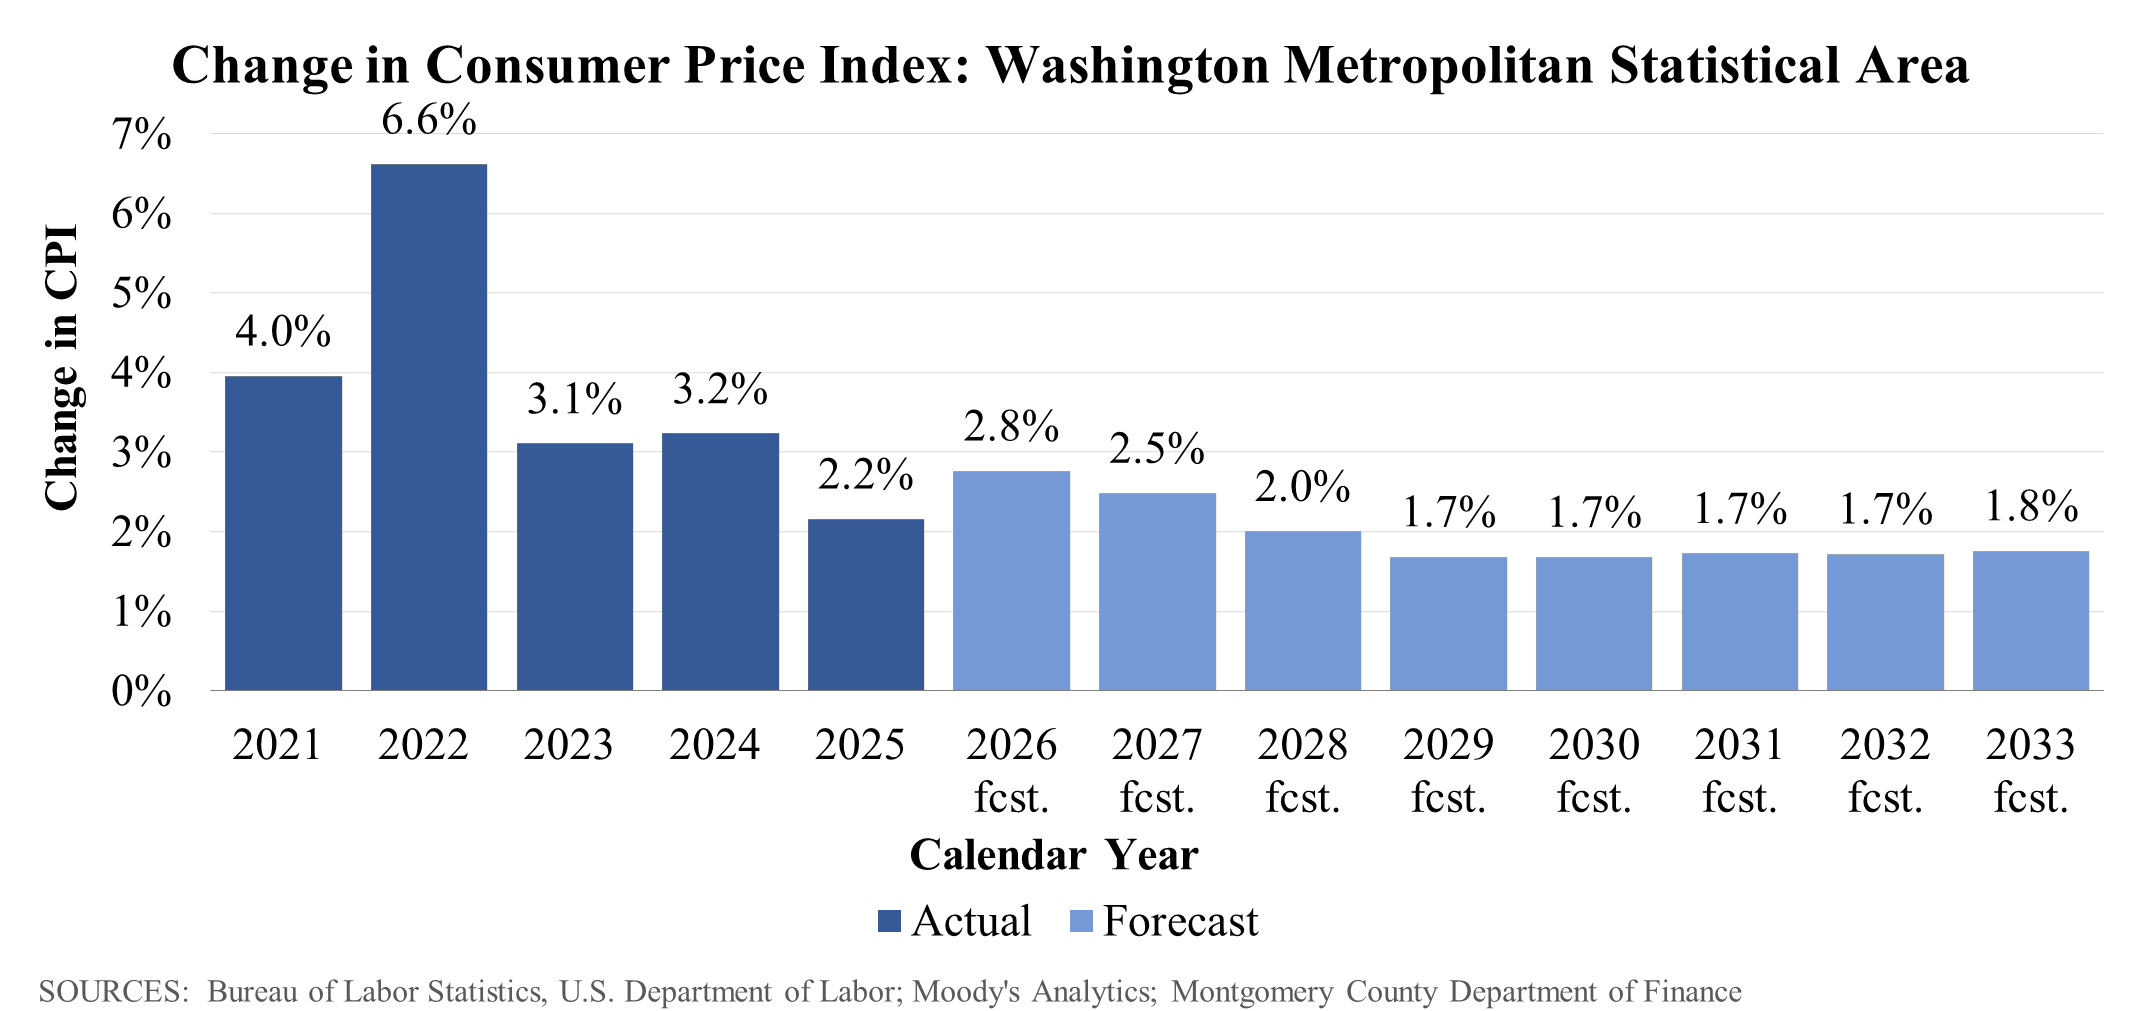
The Consumer Price Index (CPI) is based on the prices of goods and services, both domestic and imported, that consumers purchase. Inflation is influenced by trends in labor costs and simultaneously influences future wage and salary demands, which in turn impacts the County's income tax revenues. The change in home values is also influenced by the pace of inflation, indirectly influencing the County's property tax revenues.
Finance assumes that inflation in the Washington-Arlington-Alexandria, DC-VA-MD-WV metropolitan statistical area will increase modestly in CY2026 but then moderate and remain at or below the Federal Reserve's stated target of 2 percent from CY2028 to CY2023.
Interest Rates
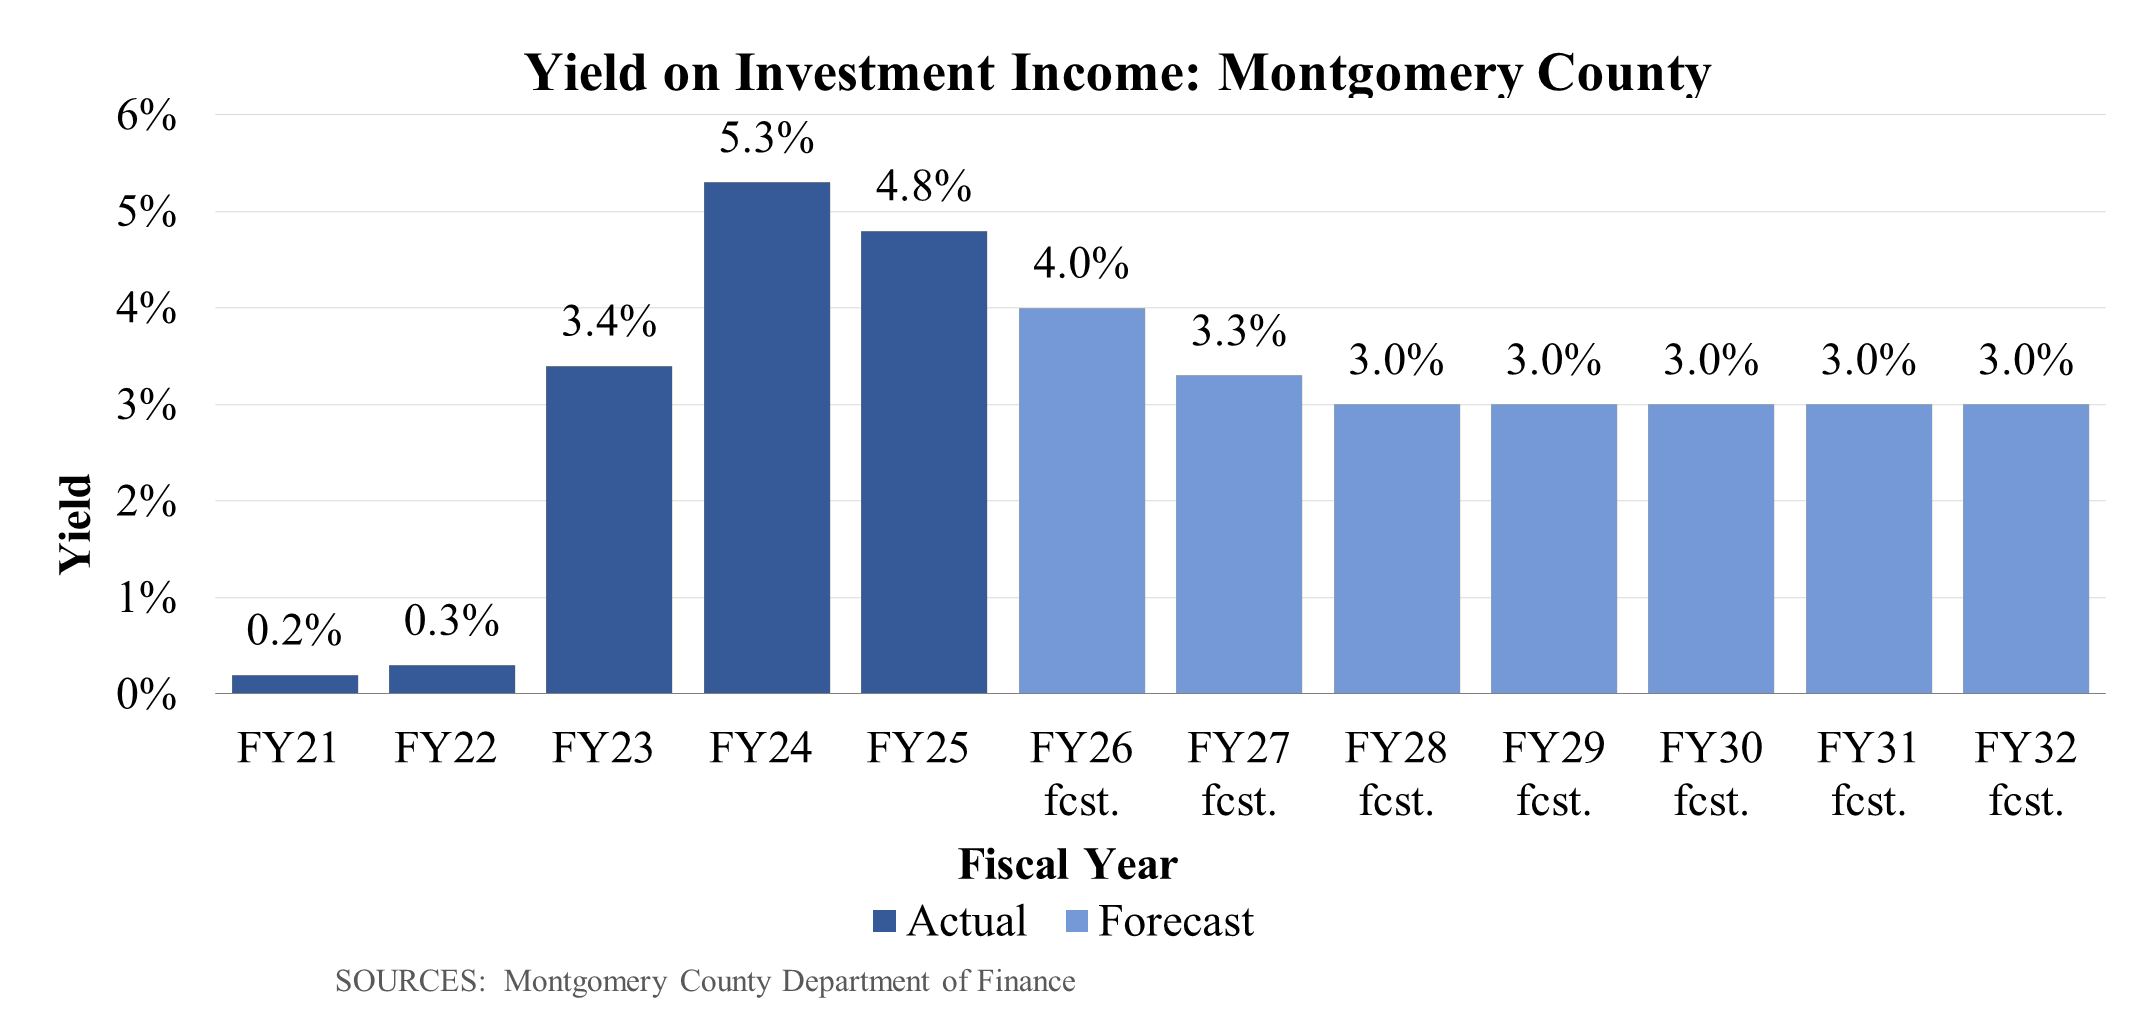
Montgomery County invests public funds not needed for immediate expenditures in short-term investments whose return is highly correlated with the Federal Funds rate. The County's yield on investment income drives the amount of revenue produced from the investment of operating cash and is also conversely an indicator of the rates the county must pay to borrow money.
Increases in the targeted federal funds rate from fiscal year (FY) 2022 to FY24 increased investment yields, with the County earning 5.3 percent rate on its short-term portfolio for FY24 and 4.8% in FY25. The Federal Reserve began lowering interest rates during 2024 and Montgomery County's investment yield has commensurately begun to fall. Finance expects the yield on investment income to continue declining to 4.0 percent in FY26, and 3.3 percent in FY27 before reaching an assumed level of 3 percent at the end of the forecast period. This assumed level from FY27 on reflects a reasonable premium on the Federal Reserve's stated goal of 2 percent inflation.
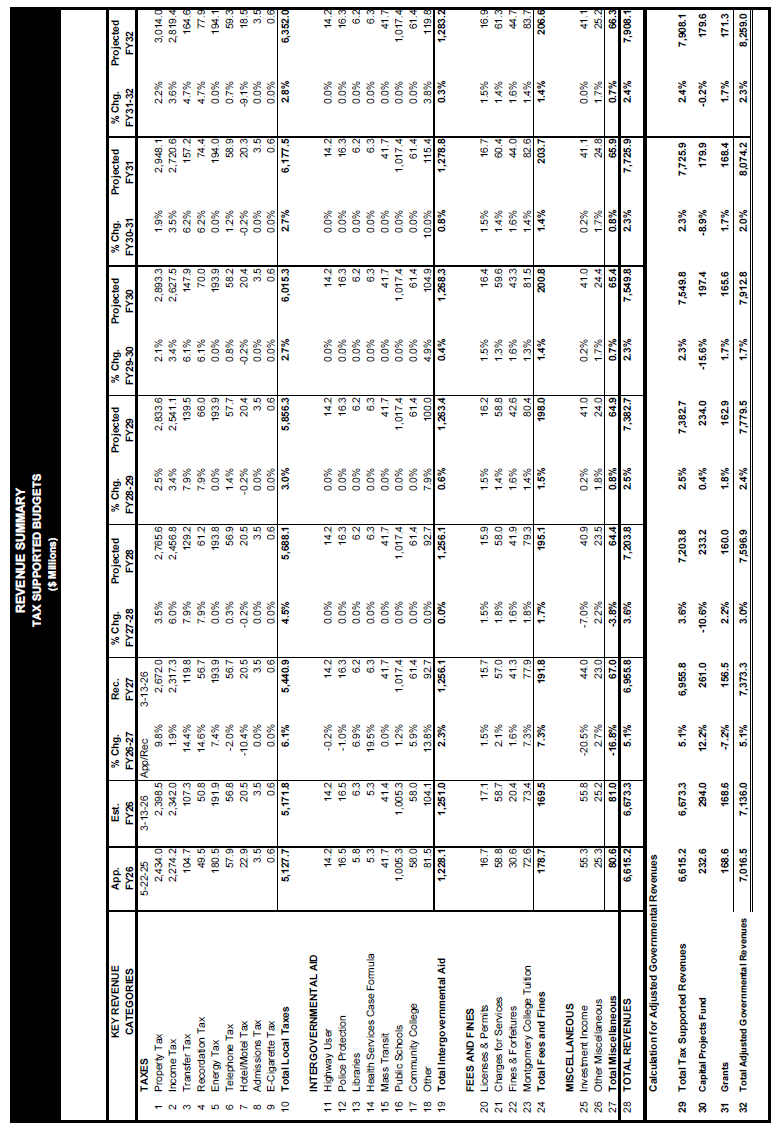
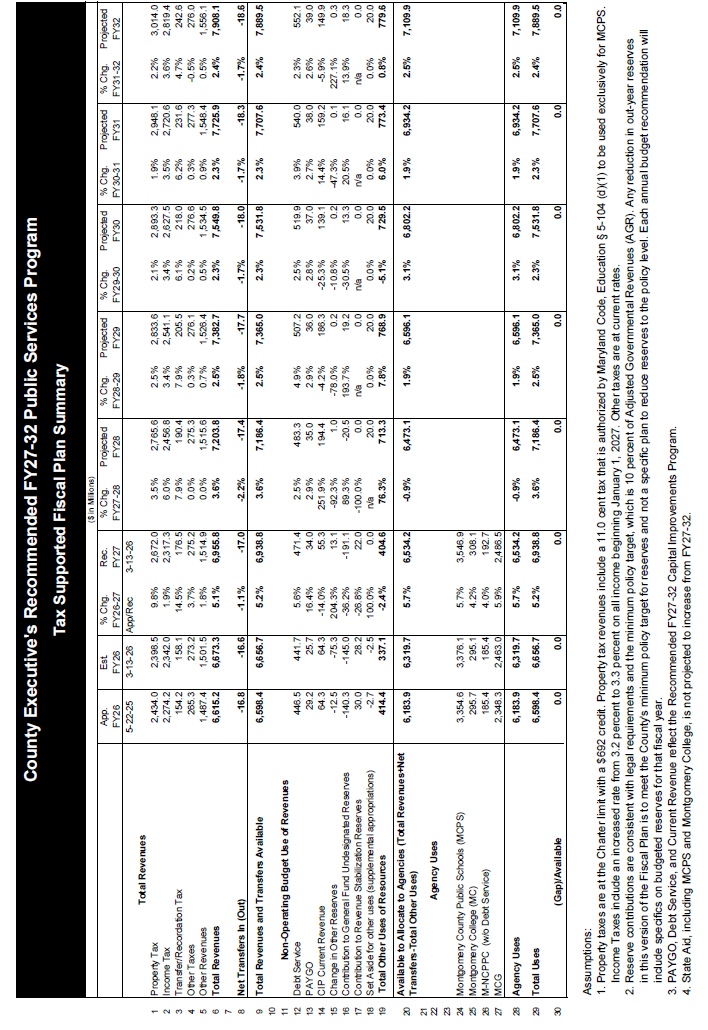
TOTAL REVENUES IN TAX SUPPORTED FUNDS
The major revenue sources for all County funds of the Operating Budget and the Public Services Program (PSP) are described below. Revenue sources which fund department and agency budgets are included in the respective budget presentations. Six-year projections for all county funds are based on estimates of County income from its own sources such as taxes, user fees, charges, and fines, and State and Federal government assistance. This section displays projections and descriptions of total revenues available for the "tax supported" portions of the program, which are subject to the Spending Affordability Guideline (SAG) limitations. Total tax-supported revenues consist of both tax revenues (i.e., property tax, income tax, etc.) and non-tax revenues (i.e., intergovernmental revenues, fees, licenses, etc.). Details on non-tax revenues in the tax-supported funds can be found in the "Other Tax-Supported Revenues" section of this chapter.
Non-tax supported funds represent another type of financial burden on households and businesses and, therefore, are considered in determining the "affordability" of all services that affect most of the County's population. Projections for non-tax supported funds within County government are presented in the budget section for each of those funds.
Revenue Assumptions
Projections for revenues are included in six-year schedules for County Government Special Funds and for Montgomery College, M-NCPPC, and WSSC in the relevant sections of this document. See the MCPS Budget Document for six-year projections of MCPS funds. Projections for revenues funding County government appropriations are provided to the Council and public as fiscal projections. Such projections are based on estimates of County income from its own sources such as taxes, user fees, charges, and fines, as well as expectations of other assistance from the State and Federal government. The most likely economic, demographic, and governmental policy assumptions that will cause a change in revenue projections are included in this section.
Projections for revenues are included in six-year schedules for County Government Special Funds and for Montgomery College, M-NCPPC, and WSSC in the relevant sections of this document. See the MCPS Budget Document for six-year projections of MCPS funds. The most likely economic, demographic, and governmental policy assumptions that will cause a change in revenue projections are included in this section.
TAX SUPPORTED REVENUES
This section discusses the tax-specific portion of revenues from the total tax-supported fund. Each tax includes relevant fiscal policy considerations that directly affect the FY27 estimates, while also discussing crucial economic indicators driving the forecasts.
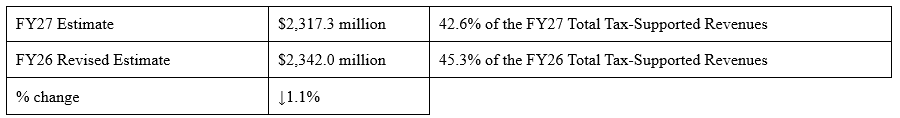
Property Tax
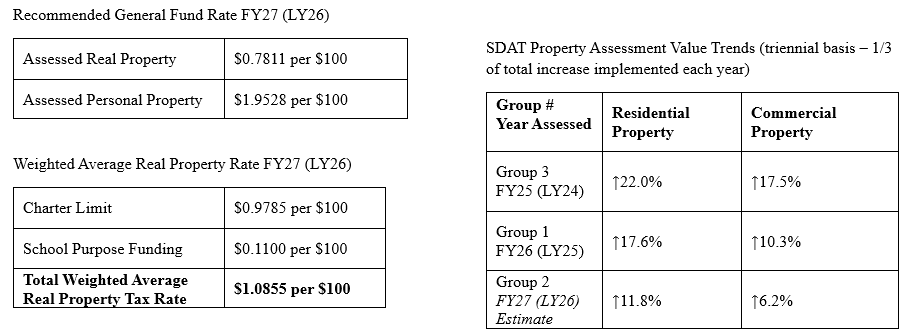
Property taxes are the largest source of revenue for the county and exhibits the least volatility to market conditions due to the reassessment process. The State Department of Assessments and Taxation (SDAT) holds the responsibility of assessing the market taxable value of Maryland properties, which are divided into three groups. Each year, the state reassesses one group, resulting in a complete reassessment of the County triennially (every three years). Increases in value of the assessments are phased over the three-year period, while decreases are effective in the first year. The "levy year" refers to the specific year for which the assessments are analyzed to set the tax rates for the upcoming fiscal year.
In addition to the general countywide tax rate, there are special district tax rates, such as certain urban areas and recreation. In November 2020, County residents voted to amend Section 305 of the County Charter to prohibit the County Council from adopting a tax rate on real property that exceeds the tax rate on real property approved the previous year, unless all current Councilmembers vote affirmatively for the increase. The FY24 approved budget included a $0.0470 general fund property tax for school purposes. This $0.0470 property tax dedicated to school funding is not included in the charter limit pursuant to § 5-104 of the State Education Article, which allows a county to set a property tax rate greater than would otherwise be allowed under the county's charter limit and may be approved by a majority of the number of councilmembers.
Starting in FY27 the County Executive proposes an additional $0.0630 property tax dedicated to school funding pursuant to § 5-104 of the State Education Article, for a total of $0.1100 in general fund property tax dedicated for school purposes. This additional tax of $0.0630 is estimated to generate an additional $164.6M in revenue versus no change in the property tax rate.
Income Tax
Income tax revenues are affected by resident employment, as well as wage and salary income trends. The base for Montgomery County's income tax is Maryland net taxable income (NTI). NTI is federal adjusted gross income, as determined by the Internal Revenue Code, with Maryland-specific adjustments, and the subtraction of Maryland standard or itemized deductions and personal exemptions. The Maryland Comptroller's Office administers the local income tax as part of the state income tax. The County receives its income tax revenues largely through quarterly distributions from withholding and estimated payments that are sent to the State. Additional distributions reconcile the quarterly distributions from the previous tax year and distribute delinquent payments, interest and penalties and other collections.
On May 8, 2020, the Maryland General Assembly enacted SB523 that amended Article II, Section 17(c), of the Maryland Constitution - Chapter 641. Specifically, the bill authorized a PTE (partnerships, limited liability companies, S- corporations, and business trusts) to elect to be taxed at the entity level for the income tax. Also, an individual or corporation may claim a tax credit against the State income tax equal to the tax paid by the PTE on the member's share of the PTE's taxable income. Because of this option to pay at the entity level, patterns of estimated and final payments may be impacted.
The County Executive proposes to increase the Montgomery County income tax rate from 3.2 percent to 3.3 percent, the maximum allowed by Maryland law, starting January 1, 2027. This income tax increase is estimated to generate $21.9M in FY27 above the FY27 forecast, assuming no change in the income tax rate. By FY30 the increase in the income tax rate is forecast to generate an additional $73.7M above the forecast assuming no increase in the income tax rate.
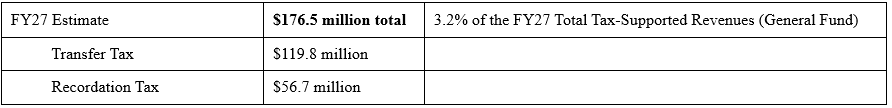
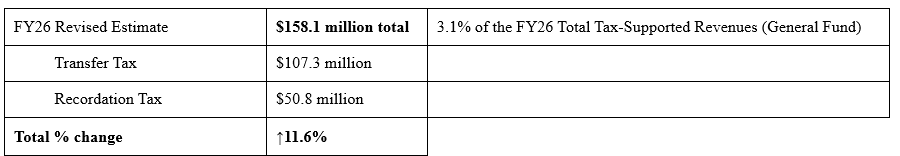
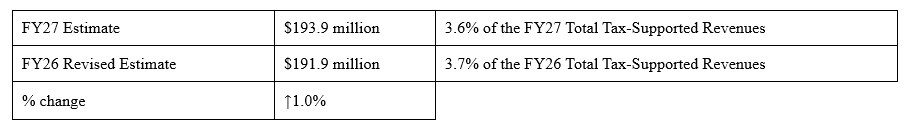
Transfer and Recordation Taxes
Transfer tax revenues are derived from the legal transfer of property; recordation tax is an excise tax imposed as compensation for registering the purchase or sale of property as public record. The revenues received strongly correlate with real estate trends, which are highly volatile. Economic indicators such as growth in personal income, formation of households, and mortgage interest rates can cause significant changes in the number of residential home sales. The volume and value of commercial property sales is affected by business activity and investment, office vacancy rates, property values, and financing costs.
Fuel-Energy Tax
The fuel-energy tax is imposed on persons or entities transmitting, distributing, manufacturing, producing, or supplying electricity, gas, steam, coal, fuel oil, or liquefied petroleum gas. Different rates apply to residential and nonresidential consumption and to the various types of fuel-energy. Since the rates per unit of energy consumed are fixed, collections change only with shifts in energy consumption and not with changes in the price of the energy product.
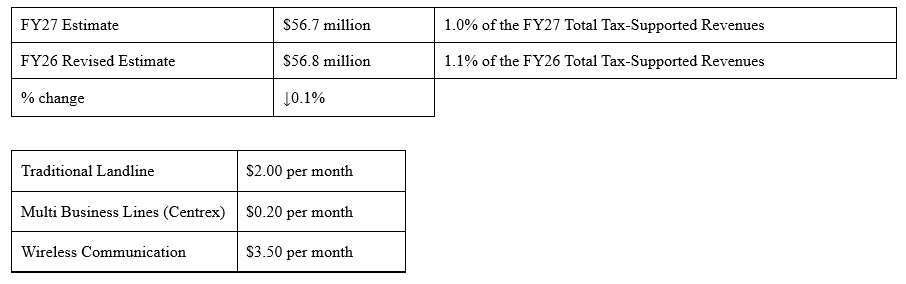
Telephone Tax
The telephone tax is levied as a fixed amount per landline, wireless communications, and other communication devices. Revenues from this tax are driven primarily by modest growth in wireless communications such as cell phones and by voice-over internet protocol. Over the past decade, approximately 80 percent of the gross telephone tax is attributed to growth in the cellular wireless component, the growth of which has moderated over the past couple of years.
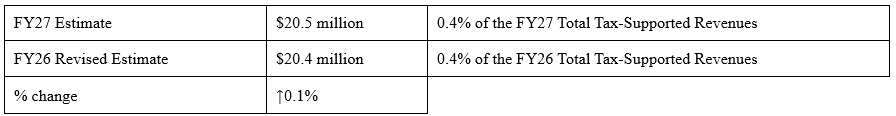
Hotel/Motel Tax
The hotel/motel tax is levied as a percentage of the hotel bill including online room rental organizations such as AirBnb; the current tax rate is 7.0 percent. Occupancy rates in the County are generally the highest in the spring (April and May) and autumn (September and October) as tourists, schools, and organizations visit the nation's capital for various events; many visitors to Washington, D.C. use hotels in the County, especially those in the southern portion of county.
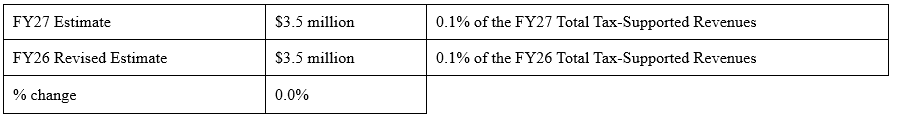
Admissions/Amusement Tax
Admissions and amusement taxes are State-administered local taxes on the gross receipts of various categories of amusement, recreation, and sports activities. Taxpayers are required to file a return and pay the tax monthly while the County receives quarterly distributions of the receipts from the State. Montgomery County levies a 7 percent tax, except for categories subject to State sales and use tax, where the County rate would be lower. Such categories include rentals of athletic equipment, boats, golf carts, skates, skis, horses, and sales related to entertainment. Gross receipts are exempt from the County tax when a Municipal admissions and amusement tax is in effect.
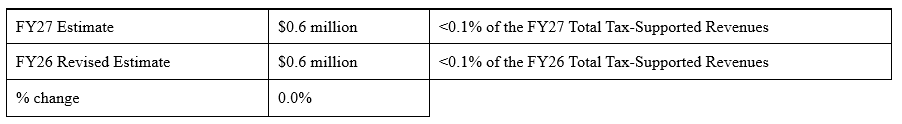
E-Cigarettes Tax
The electronic cigarette tax is a tax on any product containing or delivering nicotine or any other substance intended for human consumption that can be used by a person to simulate smoking through inhalation of vapor or aerosol from the product. On March 31, 2020, the Montgomery County Council enacted legislation that prohibited an electronic devices manufacturer from distributing flavored electronic cigarettes to certain retail stores in the County. This has resulted in e-cigarette tax revenues declining each year from the peak of $1.4 million in FY20.
OTHER REVENUES IN TAX SUPPORTED FUNDS
General Intergovernmental Revenues
Intergovernmental revenues are received from the State or Federal governments as general aid for certain purposes, not tied, like grants, to particular expenditures. The majority of this money comes from the State based on formulas set in law. Total aid is specified in the Governor's annual budget. Since the final results are not known until the General Assembly session is completed and the State budget is adopted, estimates in the March 15 County Executive's Recommended Public Services Program are generally based on the Governor's budget estimates for FY27. If additional information on the State budget is available to the County Executive, this information will be incorporated into the budgeted projection of State aid. The County Executive's FY27 Recommended Budget assumes a $5.1 million, or 0.41 percent, increase in intergovernmental revenues from the revised FY26 estimate, of which 81.0 percent of the $1.256 billion in revenues would be allocated to the Montgomery County Public Schools, 7.4 percent to other intergovernmental, 4.9 percent to Montgomery College, and 3.3 percent to Mass Transit, and 3.4 percent to the remaining intergovernmental revenues.
Licenses and Permits
Licenses and permits include General Fund business licenses (primarily public health, traders, and liquor licenses) and non-business licenses (primarily marriage licenses and Clerk of the Court business licenses). Licenses and permits in the Permitting Services Enterprise Fund, which include building, electrical, and sediment control permits, are Enterprise Funds and thus not included in tax supported projections. The FY27 Recommended Budget assumes a 7.9 percent decrease over the revised estimates for FY26, resulting in $15.7 million in available resources in FY27.
Charges for Services
Excluding intergovernmental revenues to Montgomery County Public Schools and Montgomery College, and College tuition, charges for services, or user fees, are revenues collected that come primarily from fees imposed on the recipients of certain County services including mass transit, human services, use of facilities, and recreation services and are included in the tax supported funds. The FY27 Recommended Budget for assumes a decrease of 2.9 percent over the revised estimates for FY26, resulting in $57.0 million in available resources in FY27.
Fines and Forfeitures
Revenues from fines and forfeitures relate primarily to photo red light and speed camera citations, and parking fines (excluding the County's four Parking Districts). The FY27 Recommended Budget assumes that fines and forfeitures will increase 102.2 percent from the revised estimates for FY26, resulting in $41.3 million in available resources in FY27.
College Tuition
Although College tuition is not included in the County Council's Spending Affordability Guideline Limits (SAG), it remains in the tax supported College Current Fund. Calculation of the aggregate operating budget is under the SAG Limits. Tuition revenue depends on the number of registered students and the tuition rate. The FY27 Recommended Budget assumes a 6.2 percent increase in tuition (revenues) from an estimated $73.4 million in FY26 to $77.9 million in FY27.
Investment Income
Investment income includes the County's pooled investment and non-pooled investment and interest income of other County agencies and funds. The County operates an investment pool directed by an investment manager who invests all County operating funds using an approved, prudent County Council adopted investment policy. The pool includes funds from tax supported funds as well as from Enterprise Funds, municipal taxing districts, and other governmental agencies. Two major factors that determine pooled investment income are: (1) the average daily investment balance which is affected by the level of revenues and expenditures, fund balances, and the timing of bond and commercial paper issues; and (2) the average yield percentage which reflects short-term interest rates and may vary considerably during the year.
Since achieving a peak effective rate of 5.33 percent in August 2023, The Federal Open Market Committee (FOMC) has reduced the targeted federal funds rate six times, with target rates ranging from 3.5 percent to 3.75 percent as of January 2026. The forecast anticipates that the FOMC will continue to reduce the target rate as inflation remains under control and weakness in the job market persists, but at a slower pace through 2026. The result is an expectation of a target rate of around 3.0 percent in 2027. The forecasts anticipates that the target rate will remain at 3.0 percent through the rest of the forecast period.
The revised FY26 tax-supported investment income estimate of $55.8 million assumes a yield of 4.00 percent and an average daily portfolio balance of $1.875 billion. The FY27 projected estimate of tax-supported investment income of $44.0 million assumes a yield of 3.25 percent and an average daily portfolio balance of $1.8 billion.
Other Miscellaneous
The County receives miscellaneous revenues from a variety of sources. For the FY27 Recommended Budget, miscellaneous revenues will decrease 8.7 percent from the revised estimates for FY26, resulting in $23.0 million in available resources in FY27.
IMPACT ON REVENUES AND THE CAPITAL BUDGET
The use of resources represented in this section includes appropriations to the operating funds of the various agencies of the County as well as other resource requirements, such as current revenue funding of the Capital Budget, debt service, and fund balance. These other uses, commonly called "Non-Agency Uses of Resources," affect the total level of resources available for allocation to agency programs. Some of these factors are determined by County policy or law; others depend, in part, on actual revenue receipts and expenditure patterns.
The level of PSP-related spending indirectly impacts the local economy and, hence, the level of County revenues. However, the effect on revenues from expenditures of the Executive's Recommended Operating Budget and PSP are expected to be minimal. The PSP also impacts revenues available to fund the Capital Budget. The revenue projections included in this section subtract projected uses of current revenues for both debt eligible and non-debt eligible capital investments. Therefore, the Executive's Recommended Operating Budget and PSP provide the allocations of annual resources to the Capital Budget as planned for in the County Executive's Recommended FY27-32 CIP. Anticipated current revenue adjustments to the County Executive's Recommended FY27-32 CIP have been made as part of the recommended operating budget.
Prior Year Fund Balance
The prior year fund balance for the previous fiscal year is the audited FY25 closing fund balance for all tax supported funds. The current year fund balance results from an analysis of revenues and expenditures for the balance of the fiscal year. Prior year fund balance for future fiscal years is assumed to equal the fund balance for the preceding year.
Net Transfers
Net transfers are the net of transfers in and transfers out between all tax supported and non-tax supported funds in all agencies. The largest single transfer to the General Fund is the earnings transfer from the Liquor Control Fund to the General Fund. The transfer from the General Fund to Montgomery Housing Initiative to support the Executive's housing policy is the largest transfer to a non-tax supported fund. The payment from the General Fund to the Solid Waste Disposal Fund for disposal of solid waste collected at County facilities is the next largest transfer to a non-tax supported fund. The level of transfers is an estimate based on individual estimates of component transfers.
Debt Service Obligations
Debt service estimates are those made to support the County Executive's Recommended FY27-32 CIP. Debt service obligations over the six years are based on servicing debt issued to fund planned capital projects, as well as amounts necessary for short-term and long-term leases. Debt service requirements have the single largest impact on the Operating Budget/Public Services Program by the CIP. The Charter-required CIP contains a plan or schedule of project expenditures for schools, transportation, and infrastructure modernization. Approximately 36.9 percent of the CIP is funded with General Obligation (G.O.) bonds. Each G.O. bond issue used to fund the CIP translates to a draw against the Operating Budget each year for 20 years. Debt requirements for past and future G.O. bond issues are calculated each fiscal year, and provision for the payment of Debt Service is included as part of the annual estimation of resources available for other Operating Budget requirements. As Debt Service grows over the years, increased pressures are placed on other PSP programs competing for scarce resources.
The State authorizes borrowing of funds and issuance of bonds up to a maximum of 6.0 percent of the assessed valuation of all real property and 15.0 percent of the assessed value of all personal property within the County. The County's outstanding G.O. debt plus short-term commercial paper as of June 30, 2025, is 1.46 percent of assessed value, well within the legal debt limit and safely within the County's financial capabilities.
Capital Improvements Program (CIP) Current Revenue and PAYGO
Estimates of transfers of current revenue and PAYGO to the CIP are based on the most recent County Executive recommendations for the Capital Budget and CIP. These estimates are based on programmed current revenue and PAYGO funding in the six years, as well as additional current revenue amounts allocated to the CIP for future projects and inflation.
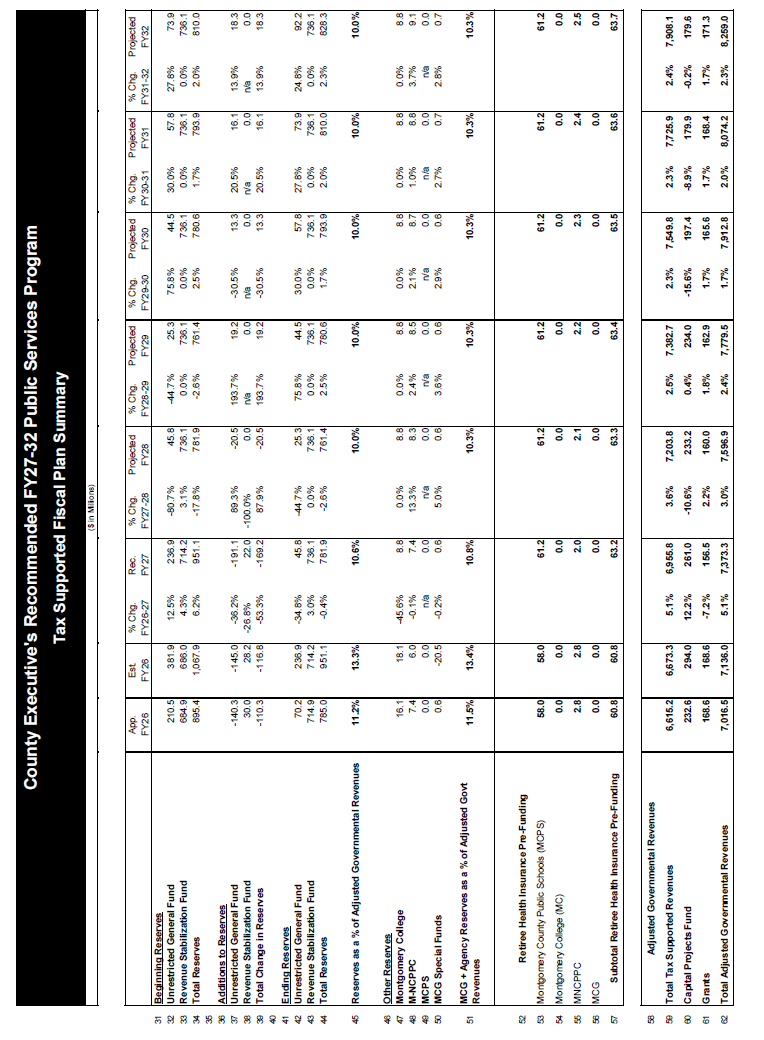
Revenue Stabilization
On June 29, 2010, the Montgomery County Council enacted Bill 36-10 amending the Montgomery County Code (Chapter 20, Finance, Article XII) that repealed the limit on the size of the Revenue Stabilization Fund (Fund), modified the requirement for mandatory County contributions to the Fund, and amended the law governing the Fund. Mandatory contributions to the Fund are the greater of 50 percent of any excess revenue, or an amount equal to the lesser of 0.5 percent of the Adjusted Governmental Revenues (AGR) or the amount needed to obtain a total reserve of 10 percent of the Adjusted Governmental Revenues. Adjusted Governmental Revenues include tax supported County Governmental revenues plus revenues of the County Grants Fund and County Capital Projects Fund; tax supported revenues of the Montgomery County Public Schools, not including the County's local contribution; tax supported revenues of Montgomery College, not including the County's local contribution; and tax supported revenues of the Montgomery County portion of the Maryland-National Capital Park and Planning Commission. All interest earned on the Fund must be added to the Fund. The FY27 Recommended Budget estimates that the Revenue Stabilization Fund balance will be $714.2 million in FY26 and the balance is estimated to increase to $736.1 million in FY27.
Other Uses
This category is used to set aside funds for such items as possible legal settlement payments and other special circumstances such as set-aside of revenues to fund future years.
Reserves
The County may maintain an unrestricted General Fund balance of up to five percent of prior year's General Fund revenues (pursuant to Charter § 310) and a combined unrestricted General Fund balance plus the Revenue Stabilization Fund balance of 10 percent of AGR. This budget more than satisfies the County's policy to maintain the budgeted total reserve of the unrestricted General Fund and Revenue Stabilization Fund at 10 percent of Adjusted Governmental Revenues with a projected combined balance of 10.6%. This leaves sufficient capacity in FY27 to address budget issues that may arise from State and Federal budget actions.